
Web Portal
Web Portal is a channel to help access various services in the Platform to make using the Platform more convenient. To access the Web Portal, you can access it at https://portal.nexiiot.io. Once you have successfully logged in, the screen will appear as shown in the following image.
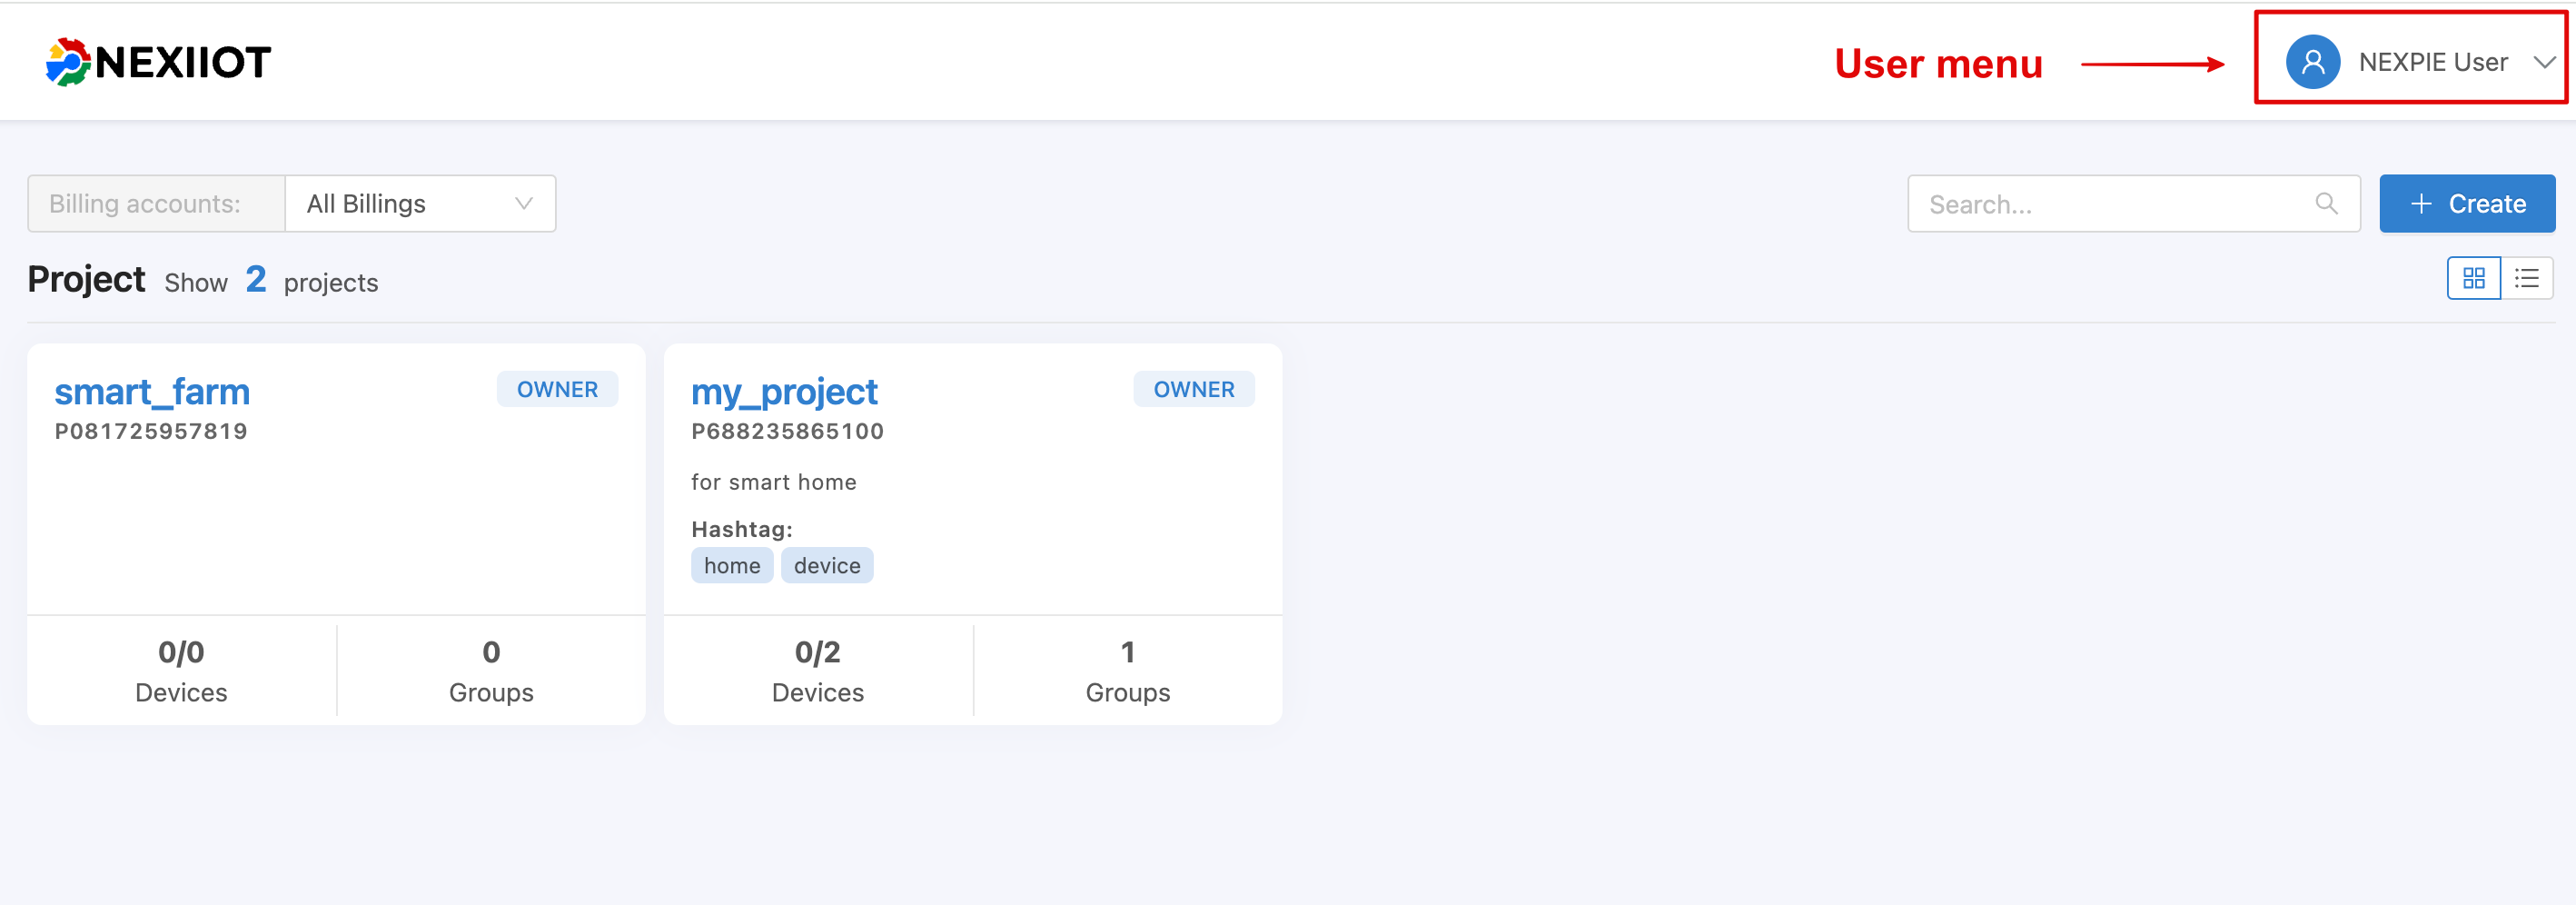
User
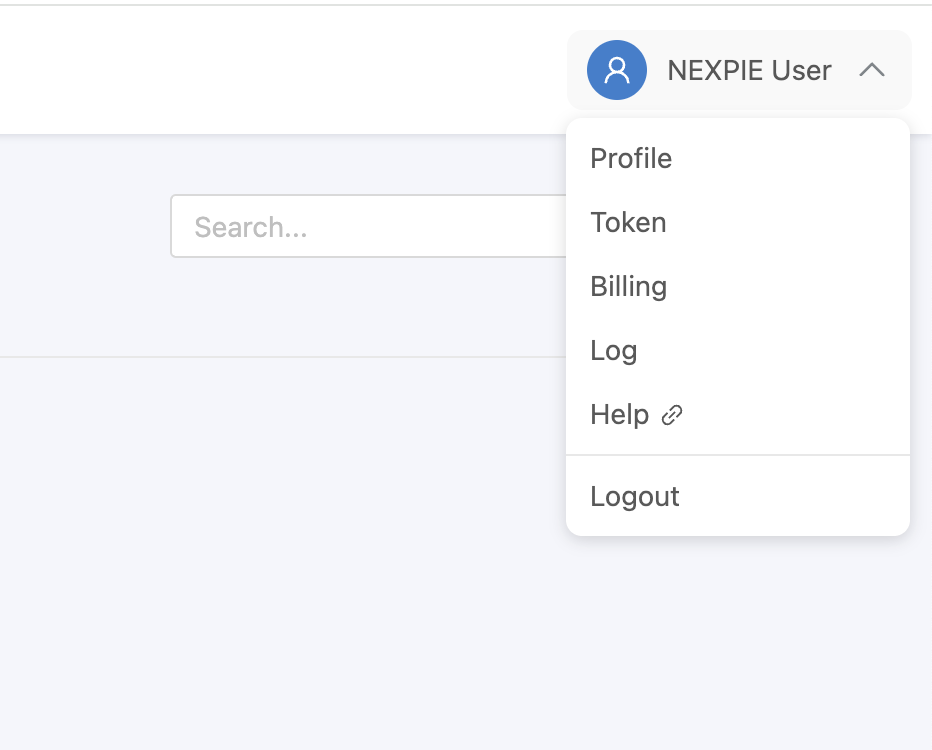
The top right corner shows the username. When clicked, it will show the submenus related to the user, as shown in the figure.
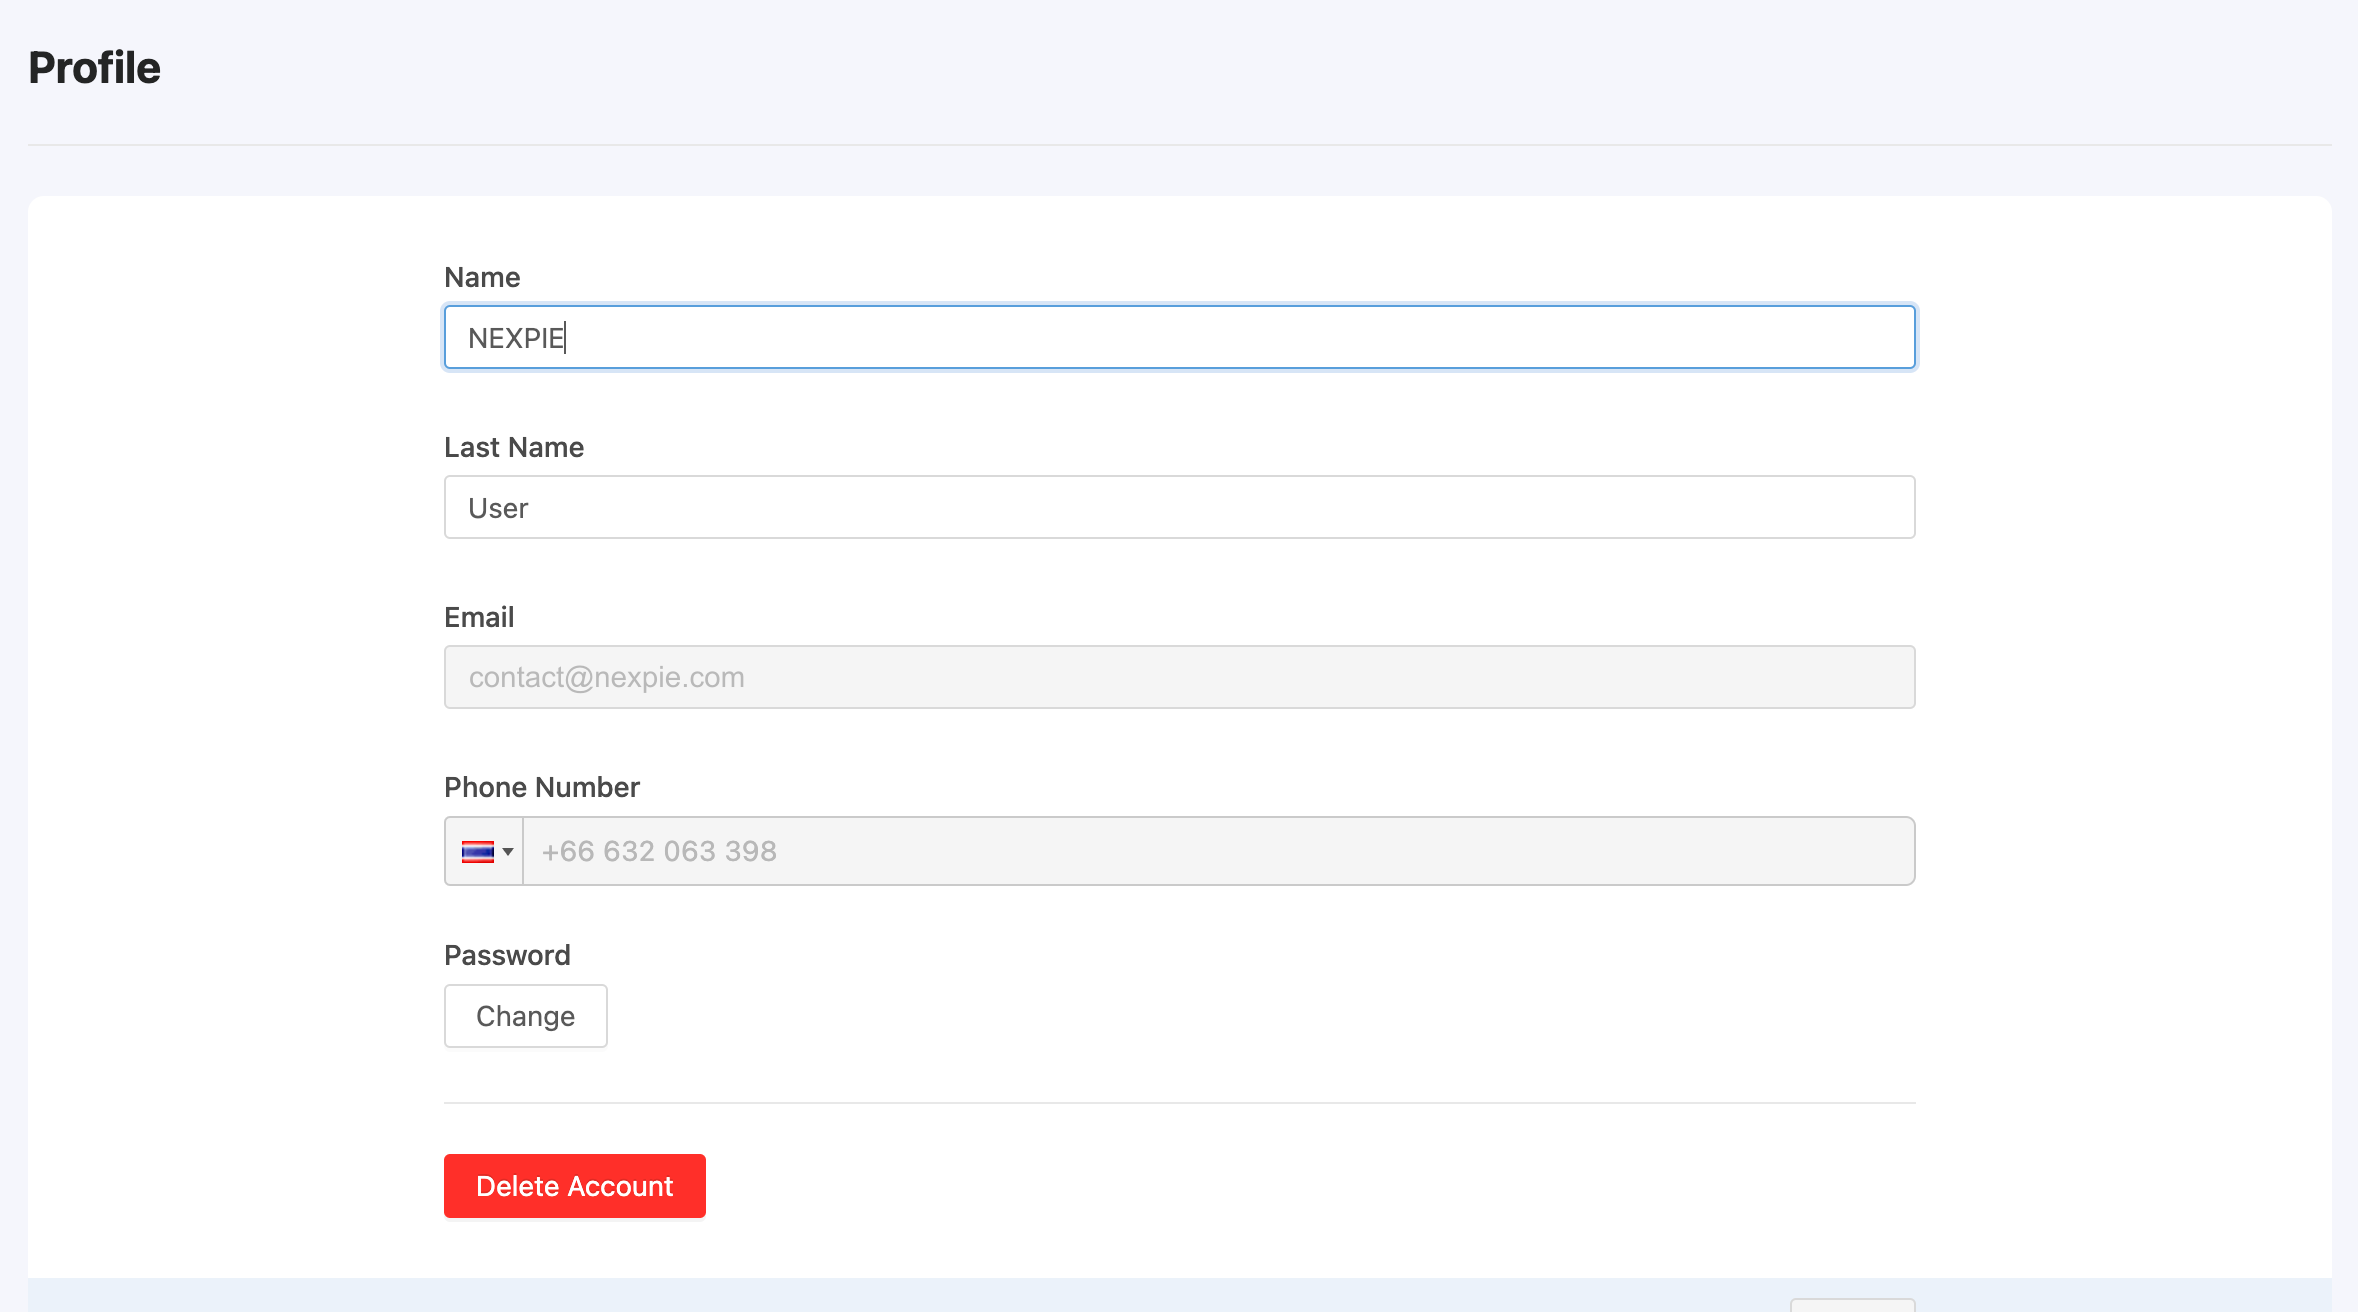
"Profile" menu
For users to view personal information and edit some information, including changing the password to log into the system, or if they want to delete the account from the system because they are no longer in use, they can click the "Delete Account" button as shown in the following image.
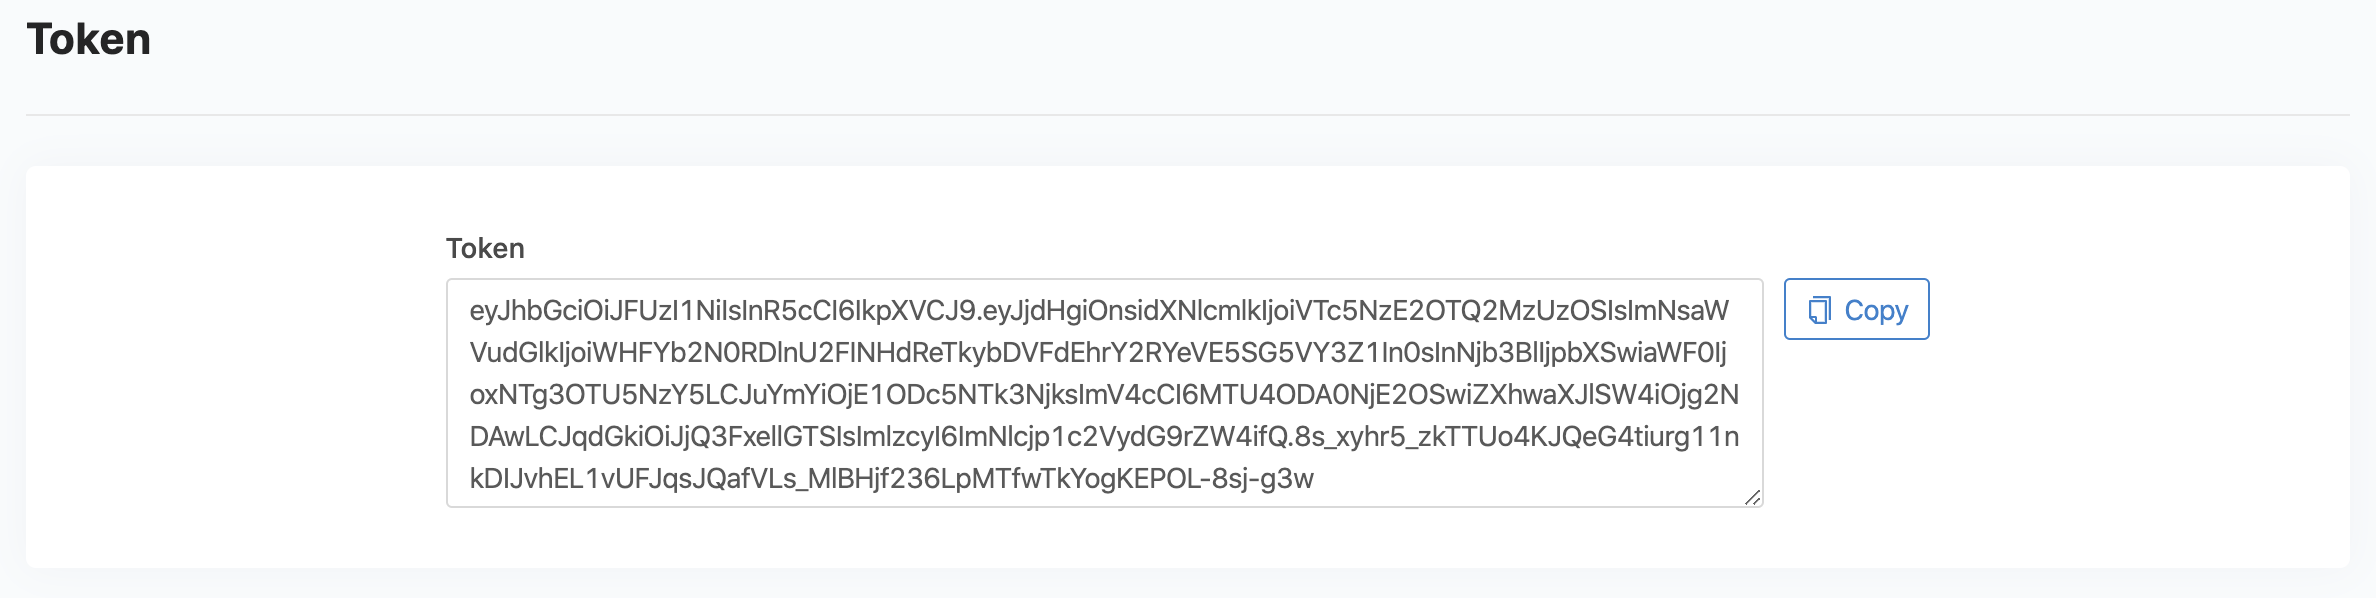
"Token" menu
For displaying your own User Token information, which will be used in cases of using APIs or other services that require permission before use, as follows:
"Billing" menu
To display information about service packages, service round information, and usage volume of various services on the Platform, which will be information related to the calculation of service fees, as follows:
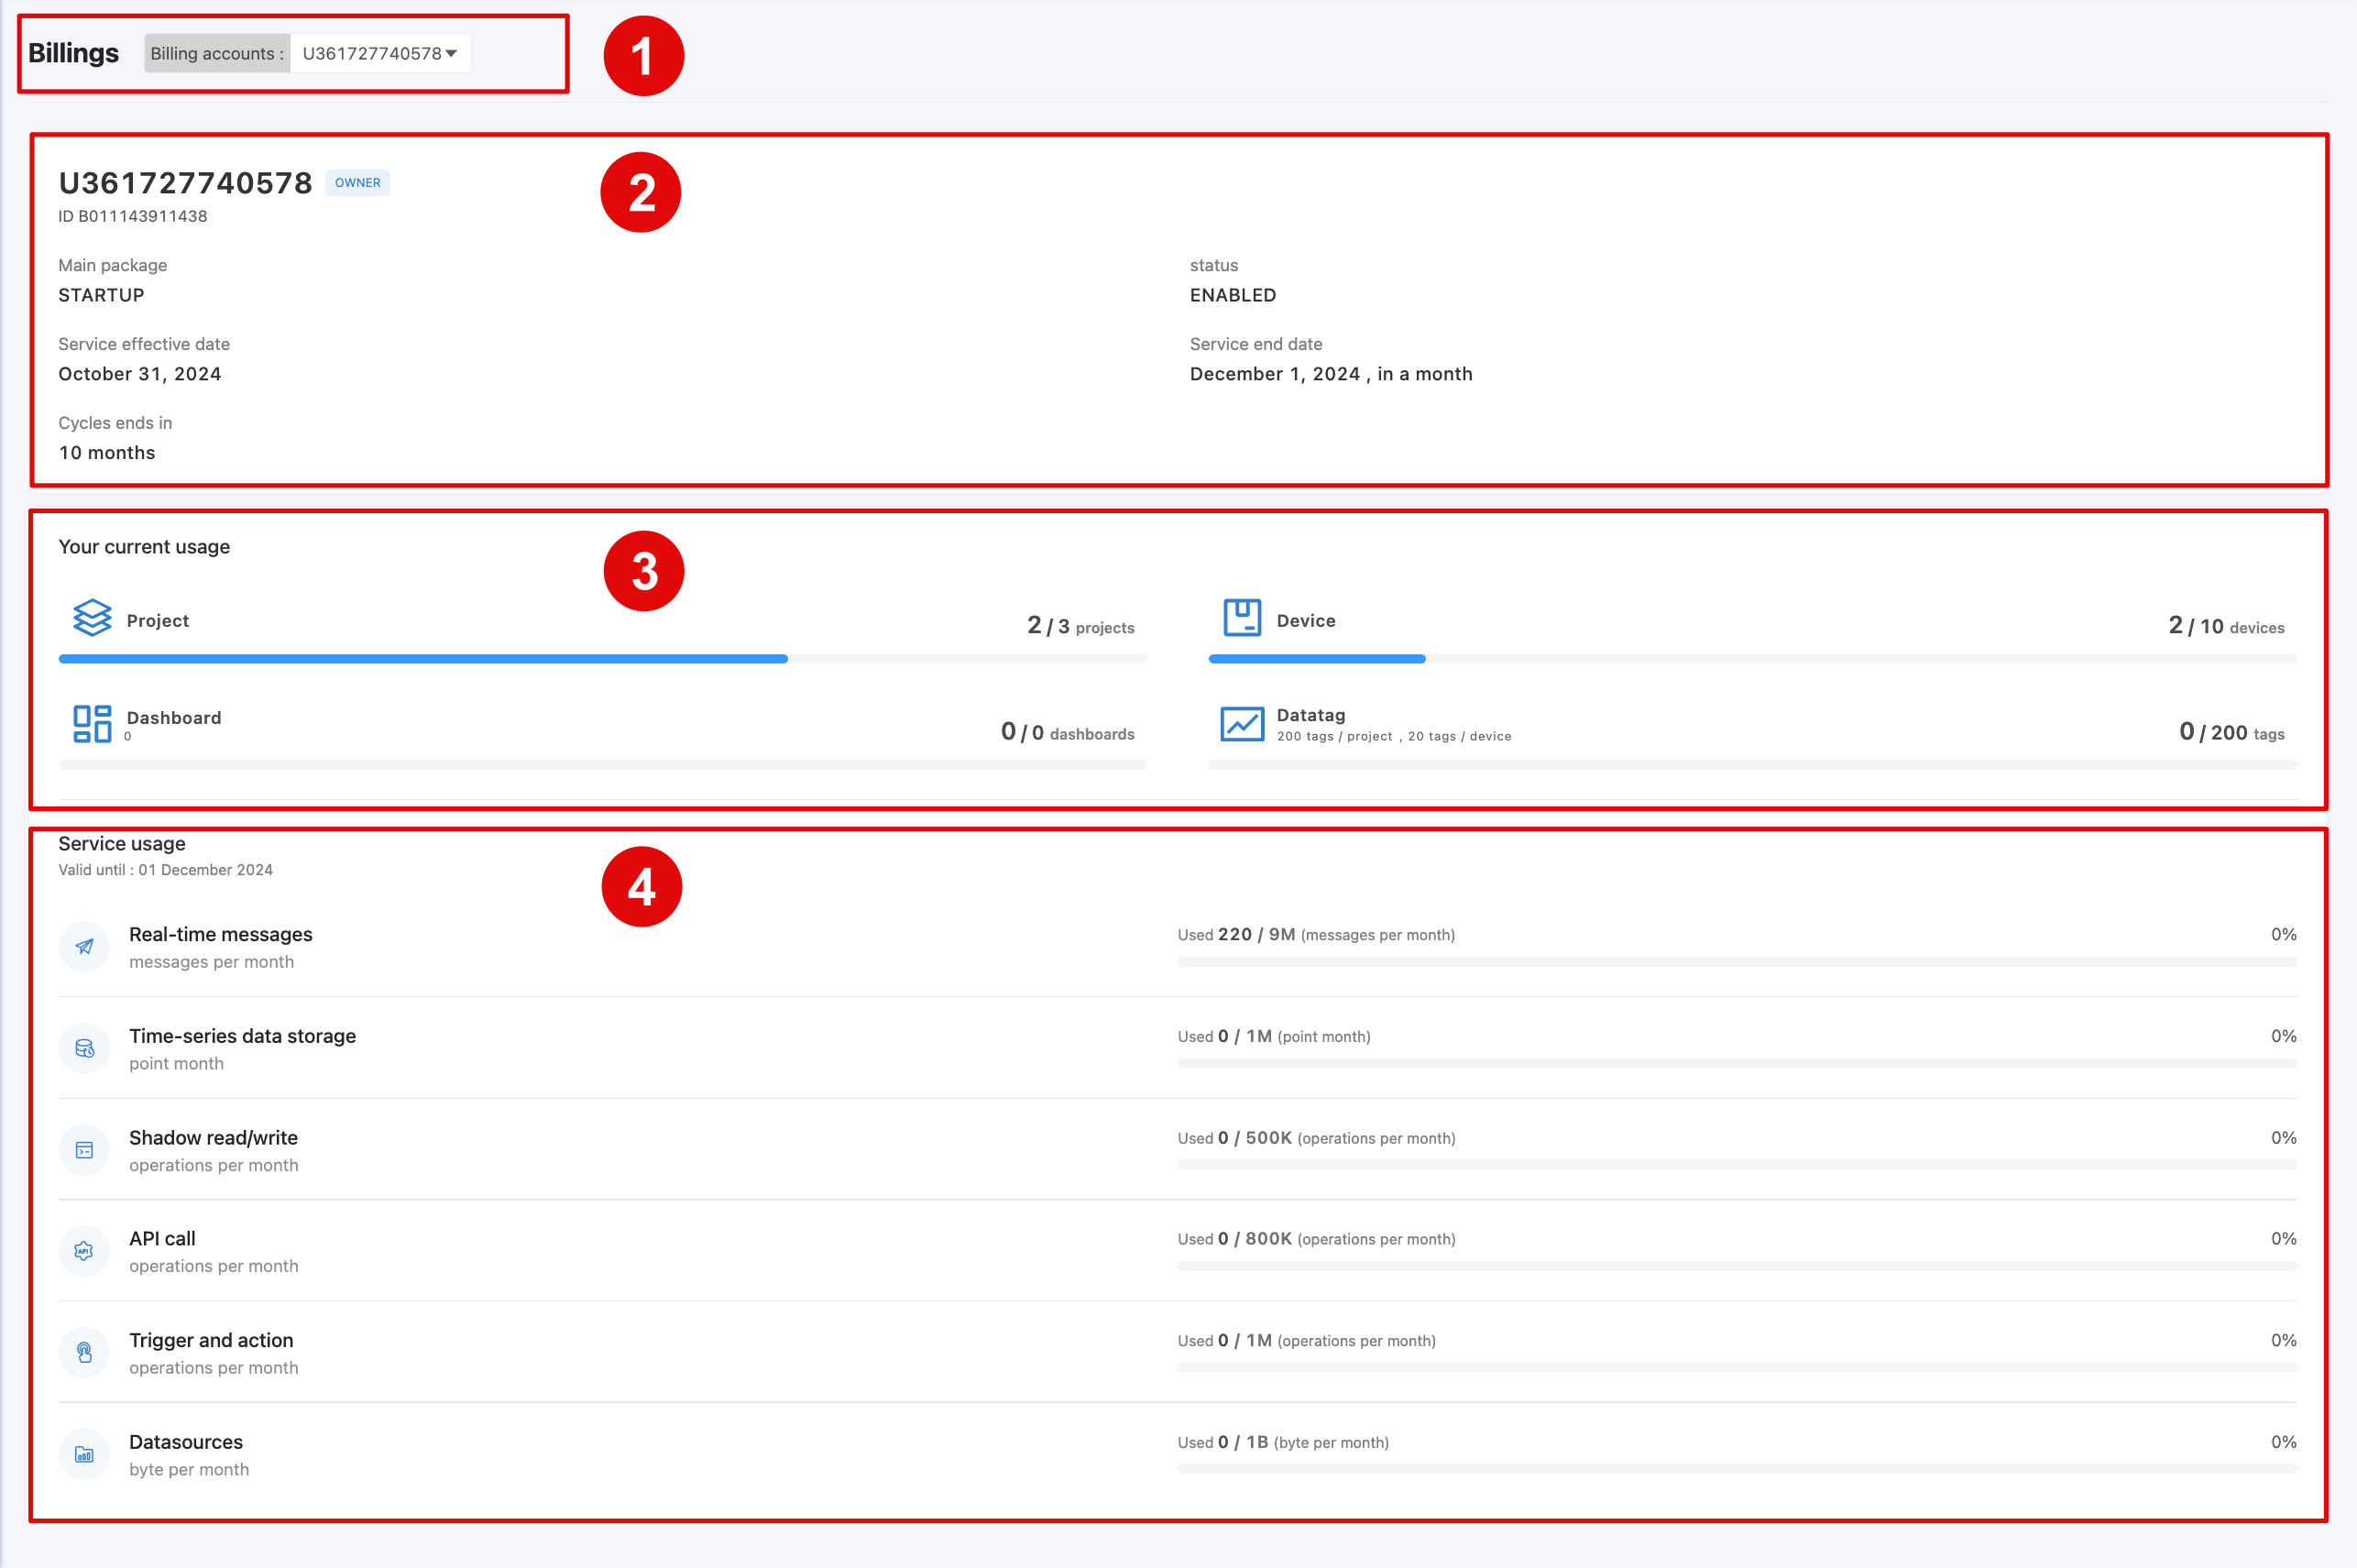
From the figure above, the data consists of 4 parts:
Part 1 Billing Account Name indicates which Billing the information is displayed under (if there is more than 1 Billing, you can select to view information for each Billing).
Part 2 Billing Account Detail shows the details of that Billing, including:
Name, ID and Permission(From the picture: U361727740578, B011143911438 and OWNER)Main packageis the usage quota package that is allocated in each usage round.Statusis the status of Billing usage (ENABLED : active, DISABLED : disabled).Service effective dateis the start date of the current service period.Service end dateis the end date of the current service period (normally, 1 service period lasts for 1 month).Cycles ends inis the number of remaining usage cycles.
**Part 3: Limited usage quota ** includes:
Projectis the total number of projects that can be created under Billing (used/all).Deviceis the total number of devices that can be created under Billing (used/all).Dashboardis the total number of Dashboards that can be created under Billing (used/all).Datatagis the total number of Datatags that can be created under Billing (used/all) [Number of Datatags that can be created in each Project, Number of Datatags that can be created in each Device].
Section 4: Expired quota includes (but this quota will be reset every time a new usage cycle begins):
Real-time messagesis the number of Publish/Subscribe Messages that can be sent and received. The unit of measurement is message. If this service is out of service, all MQTT Protocol operations will not work. For more details on the usage count, see Real Time MessageTime-series data storageis the amount of data that can be saved for retrospective viewing. The unit of measurement is point-month. If this service is used up, data cannot be saved for retrospective viewing. For details on counting the number of uses, see Time Series Data StoreShadow read/writeis the number of Shadow read/write operations. The unit of operation is counted as an operation. If this service is exhausted, it will not be able to Read/Write Shadow. It also affects other services that operate through Shadow, such as saving data to Time-series data storage through Write Shadow, which will not be able to save. For more details on counting usage, see Shadow Read/WriteAPI callis the number of REST API usage. The unit of measurement is operation. If this service is exhausted, all REST API operations will not work. For more details on usage count, see API CallTrigger and actionis the number of Trigger and Action usages that occur. The unit of count is operation. If this service is exhausted, the various notifications that have been set will not work. For more details on counting usage, see Trigger & ActionDatasourcesis the cumulative amount of data size (in Byte) that occurs from downloading data from Time-series data storage. If this service is exhausted, it will result in the inability to retrieve data from Time-series data storage, see Datasource
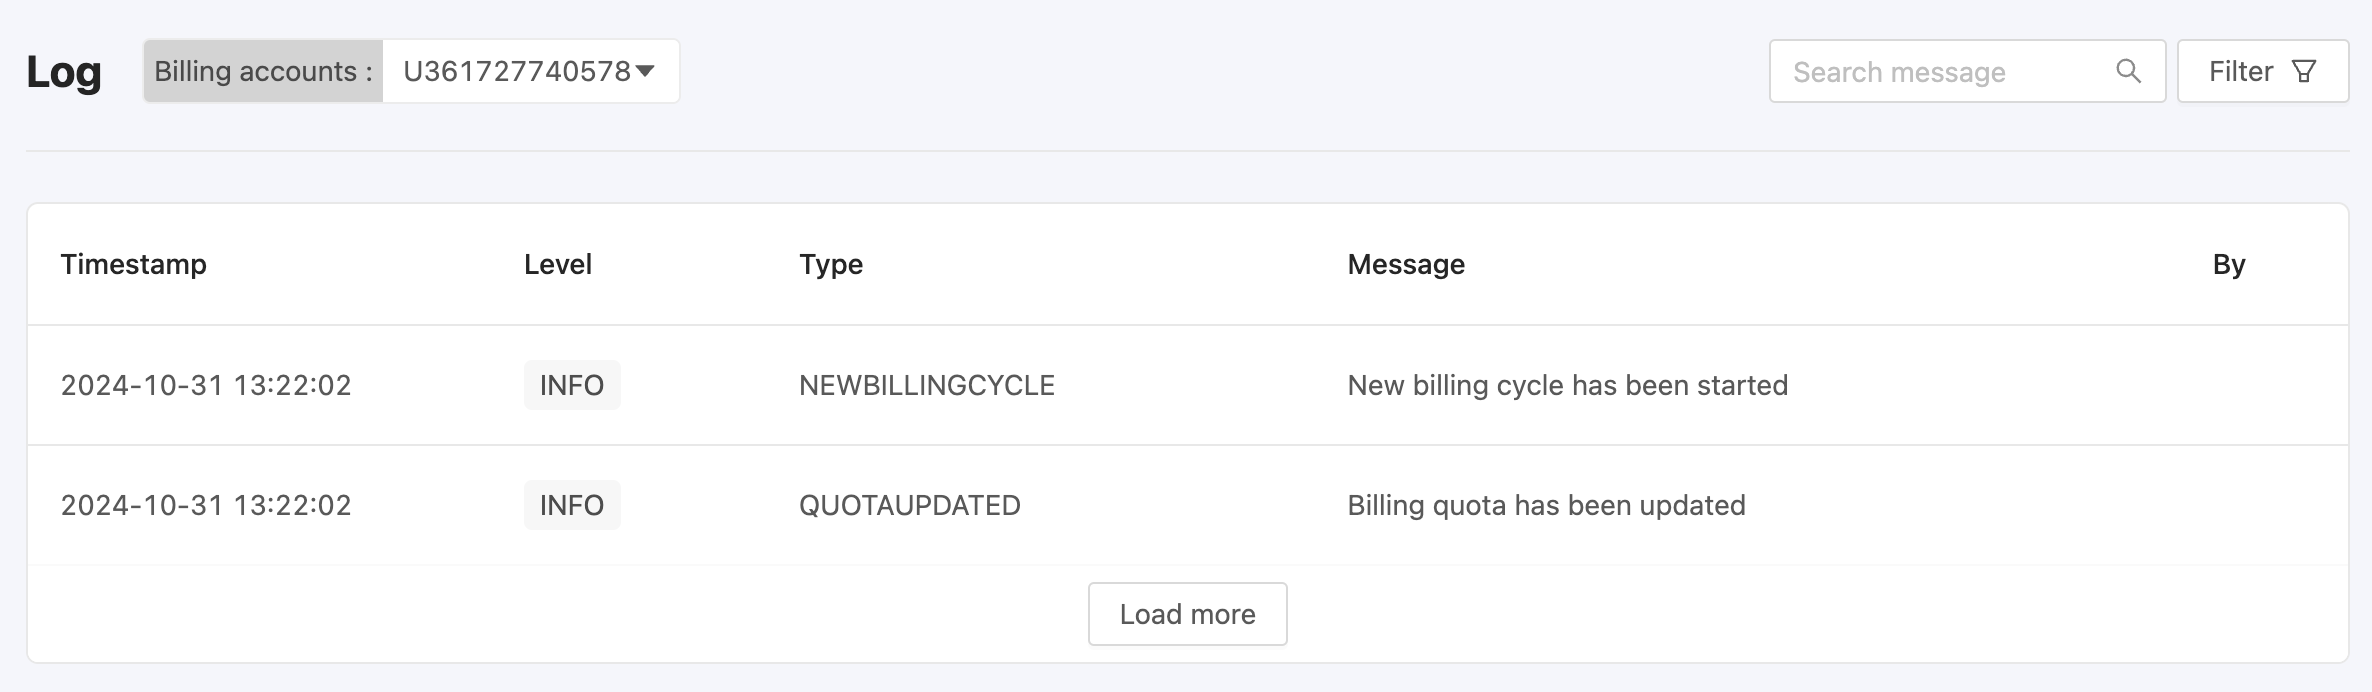
"Log" menu
To view various log data that the system monitors and records, separated into 3 types.
Infois to inform the recipient of the information, such as Billing starting a new usage cycle, etc.Warningis to notify users and take some action before it affects their usage, such as running out of quota.Erroris a critical level warning. The user must take some action urgently because it has an impact on the usage or it is an improper usage that affects the system operation, such as a problem with the device.
Project
This is the first information that will be found after logging in. The system will display a list of all projects that the user has access to (if any), as shown in the figure.
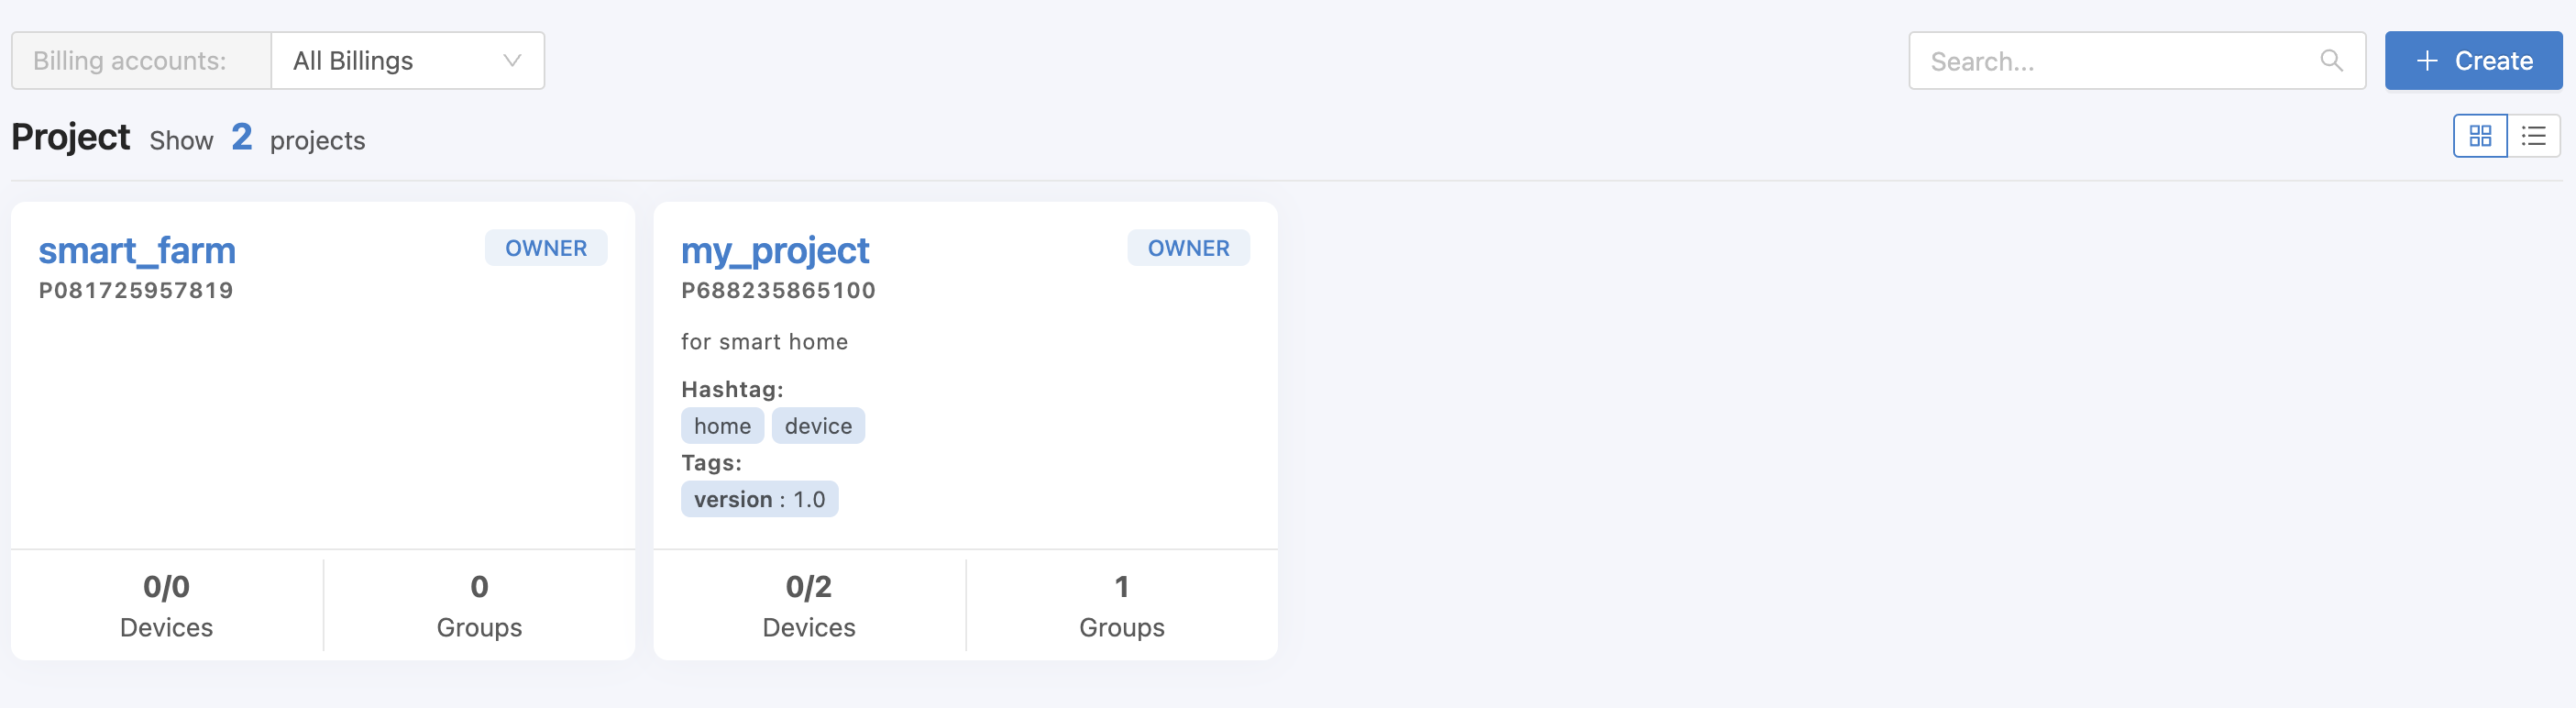
In each project, there will be a summary of basic details about that project, which includes the following information:
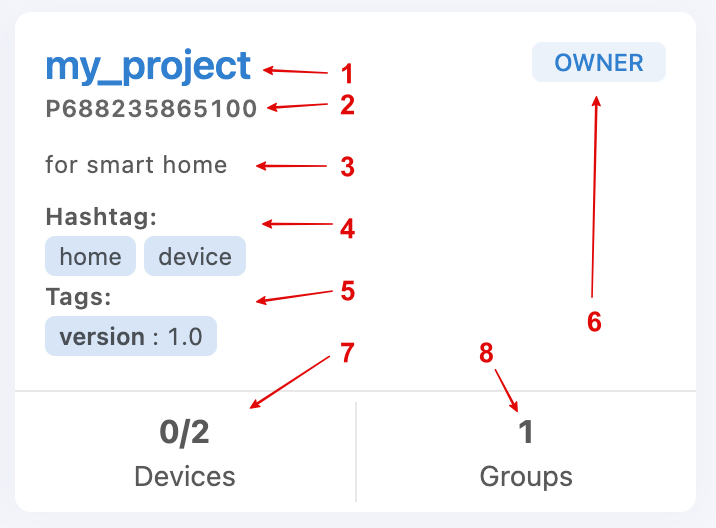
Project Name is the name of project
Project ID is the ID of project. The system will automatically generate the project code for reference when using certain services, such as APIs.
Project Description is the description of project
Hashtag is used as a keyword (Key Word) and is used for filtering data (filter).
Tags is used as a key-value and are used for filtering data.
Data access level (for more details, please see Member)
The number of devices in a project will be in the form a/b (a is the number of devices online, b is the total number of devices).
Number of Groups in Project.
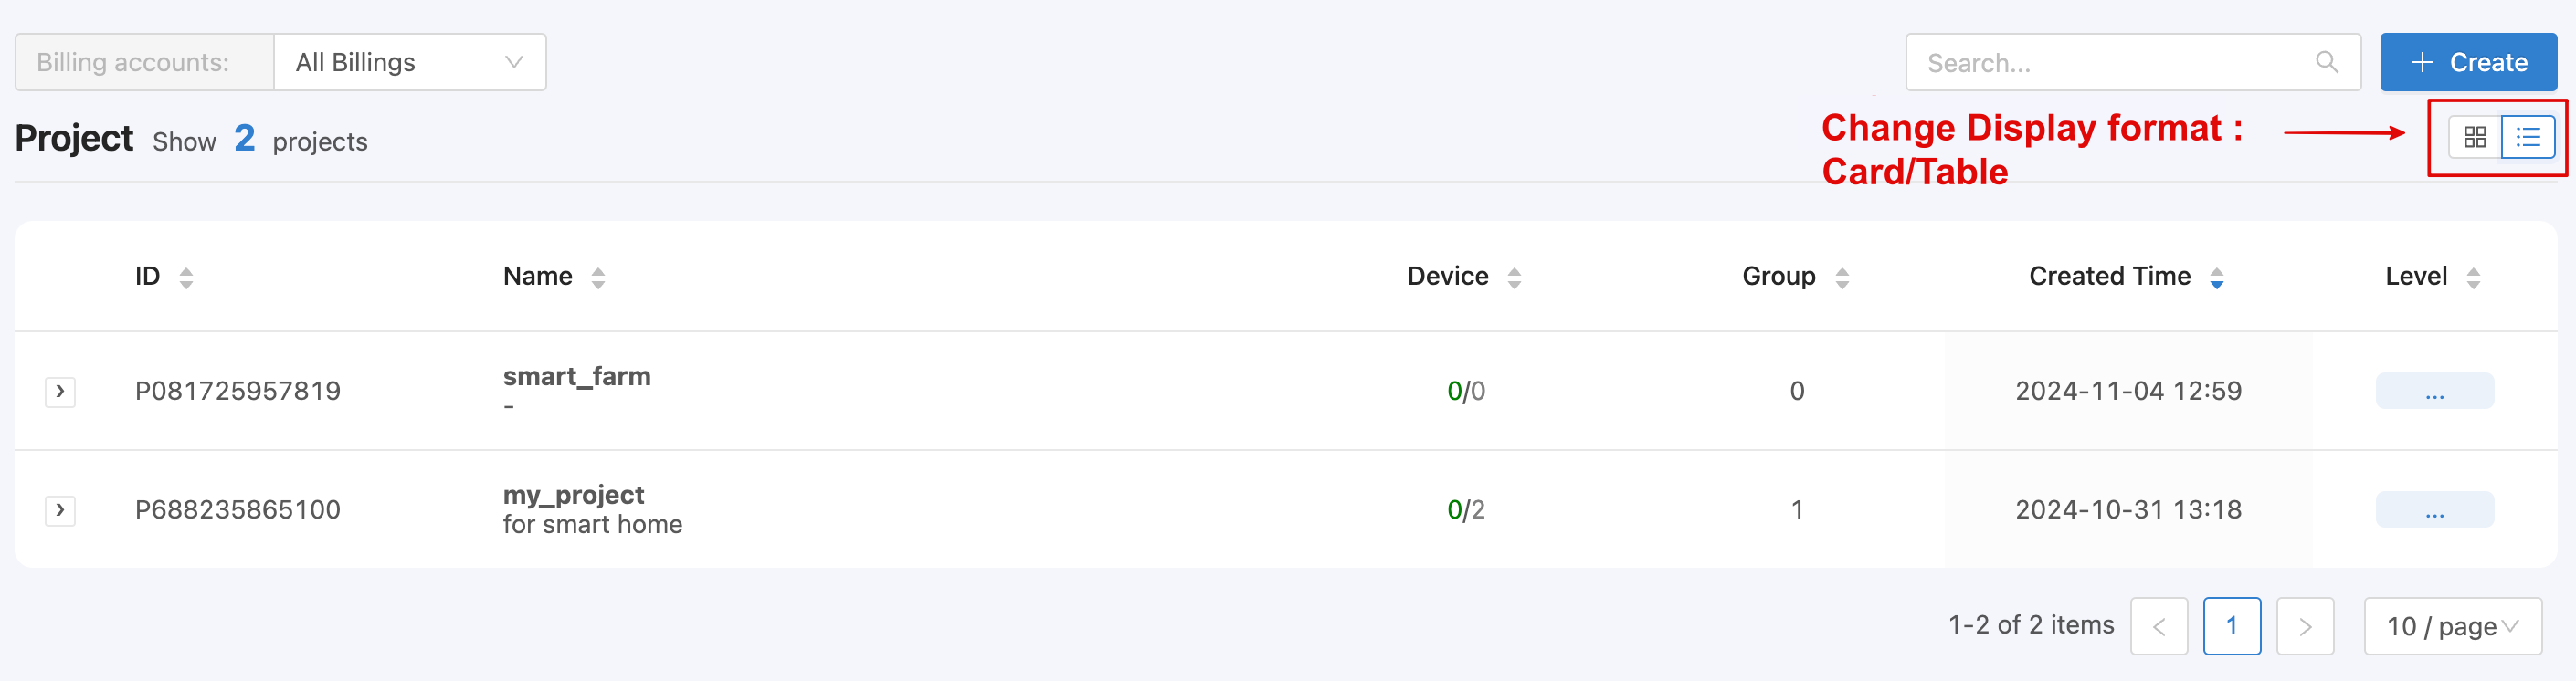
Project list display format can be in 2 types: Card (Default) or Table. You can change the format by selecting the icon in the upper right corner. If displayed in Table format, it will look like the following image.
To create a new Project, click the "Create" button on the top right corner, and a form for filling in Project information will appear as shown in the image below.
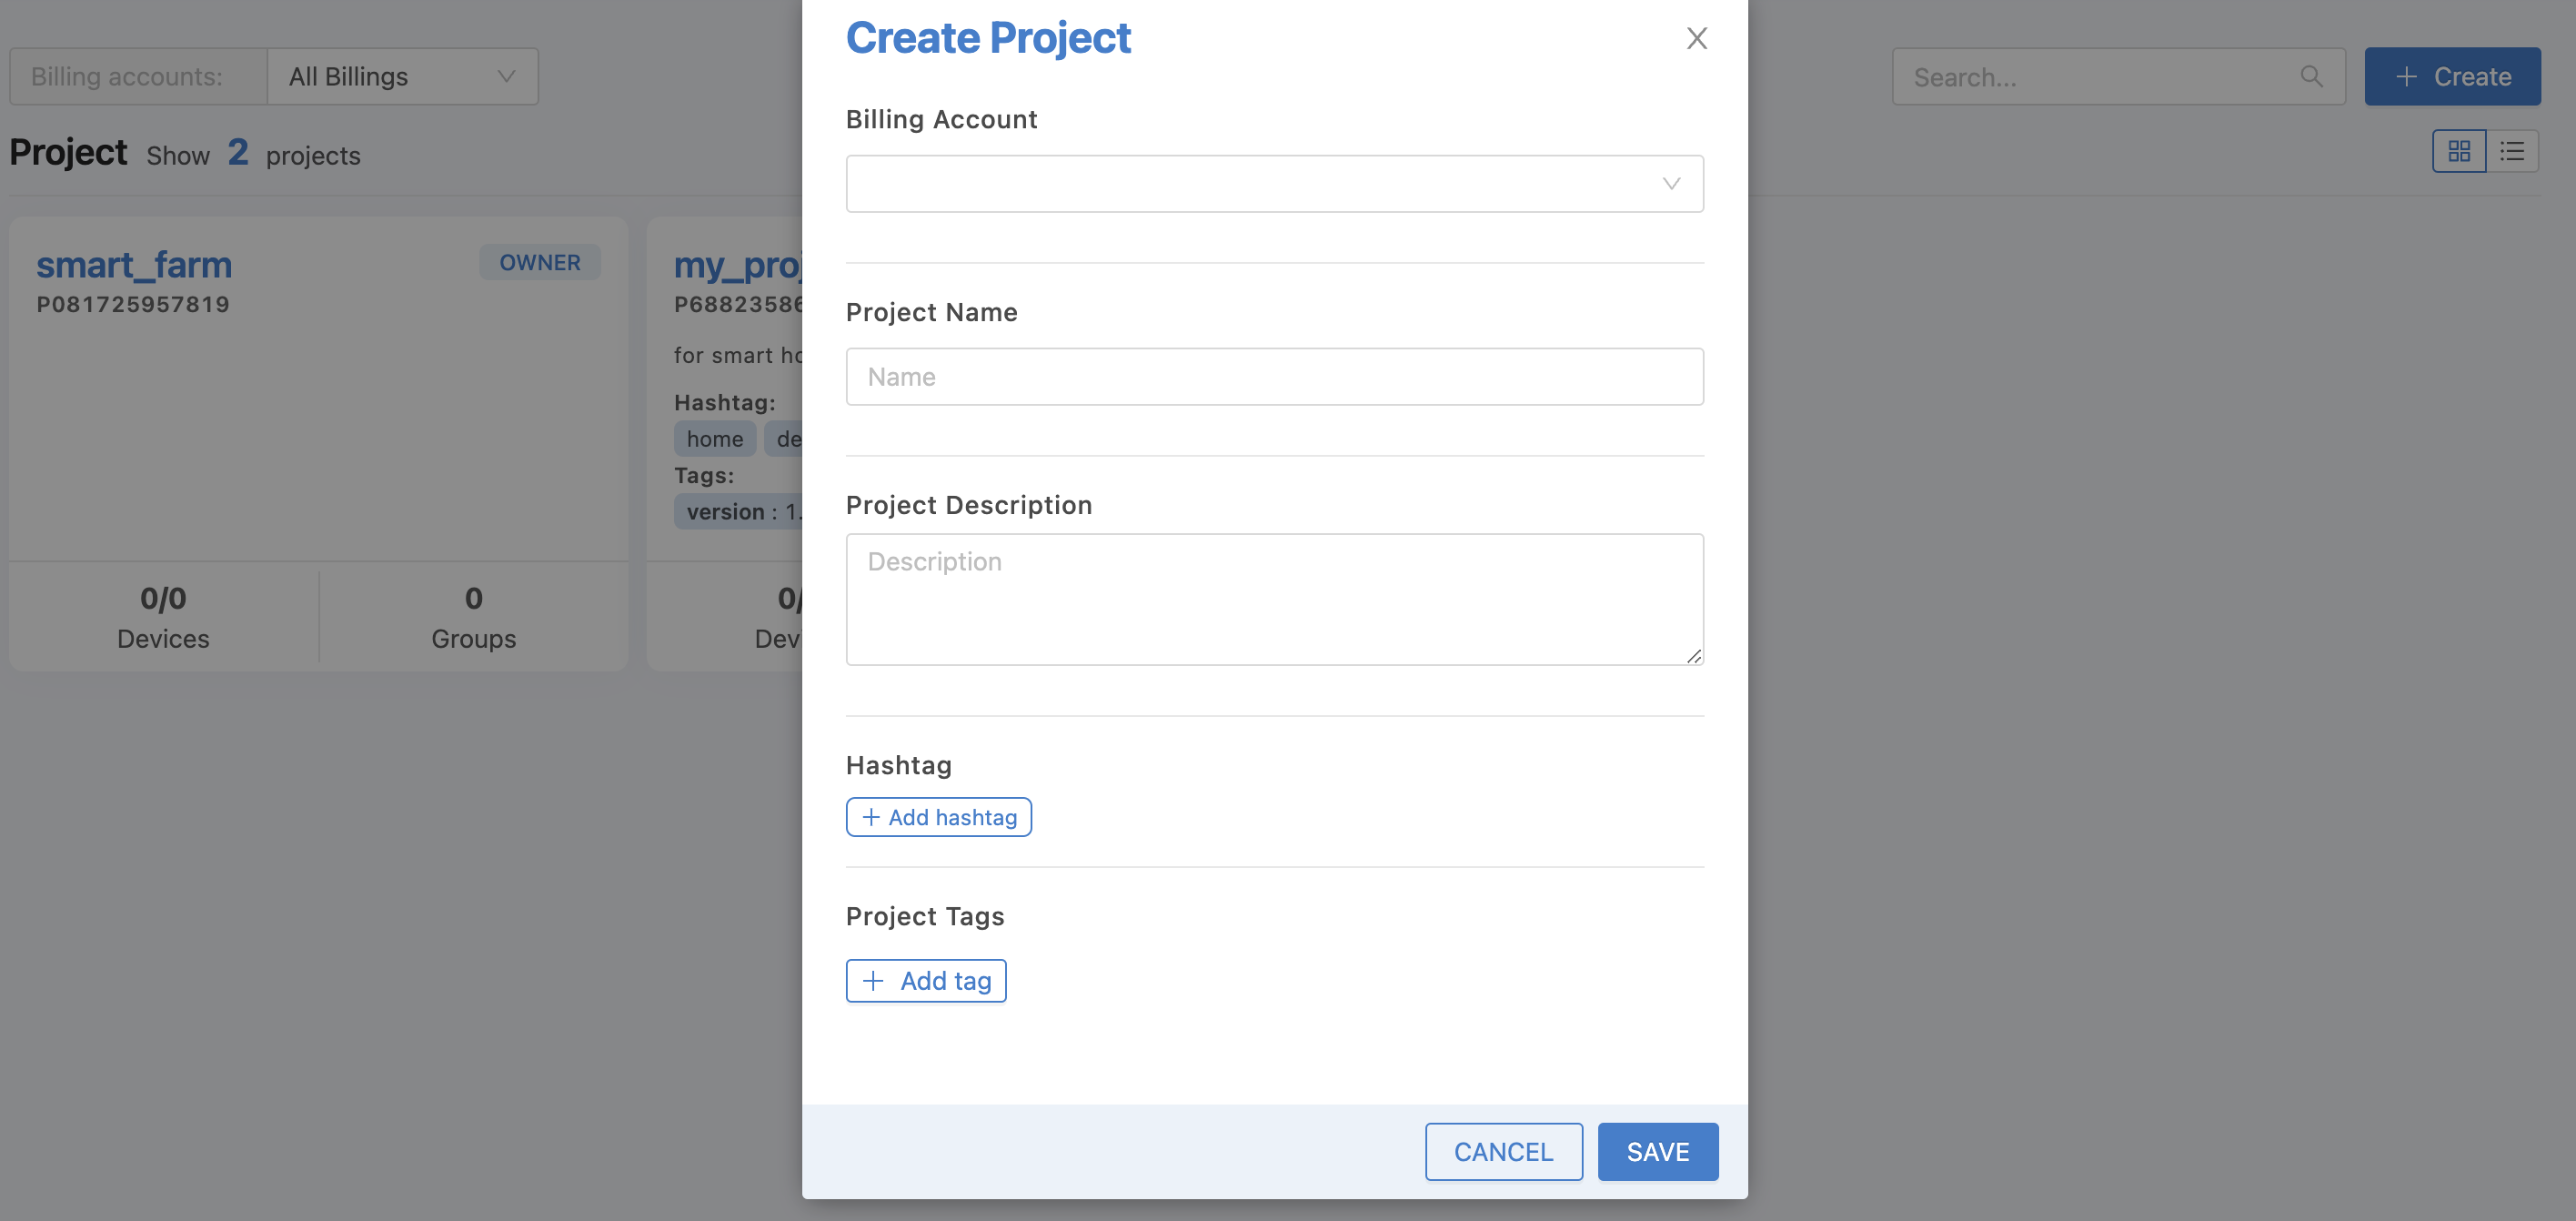
From the image above, the project information that can be specified is as follows:
Billing Account |
Billing Account that you want the Project to belong to to calculate usage volume. |
Project Name |
Project names do not allow white spaces in the name. |
Project Description |
Project Description |
Hashtag |
Keywords are used to filter data. |
Project Tags |
Key-Value is used to filter data. |
When you have filled in all the information, click on the "SAVE" button. The system will take you to the newly created Project to manage the various sections as shown in the figure.
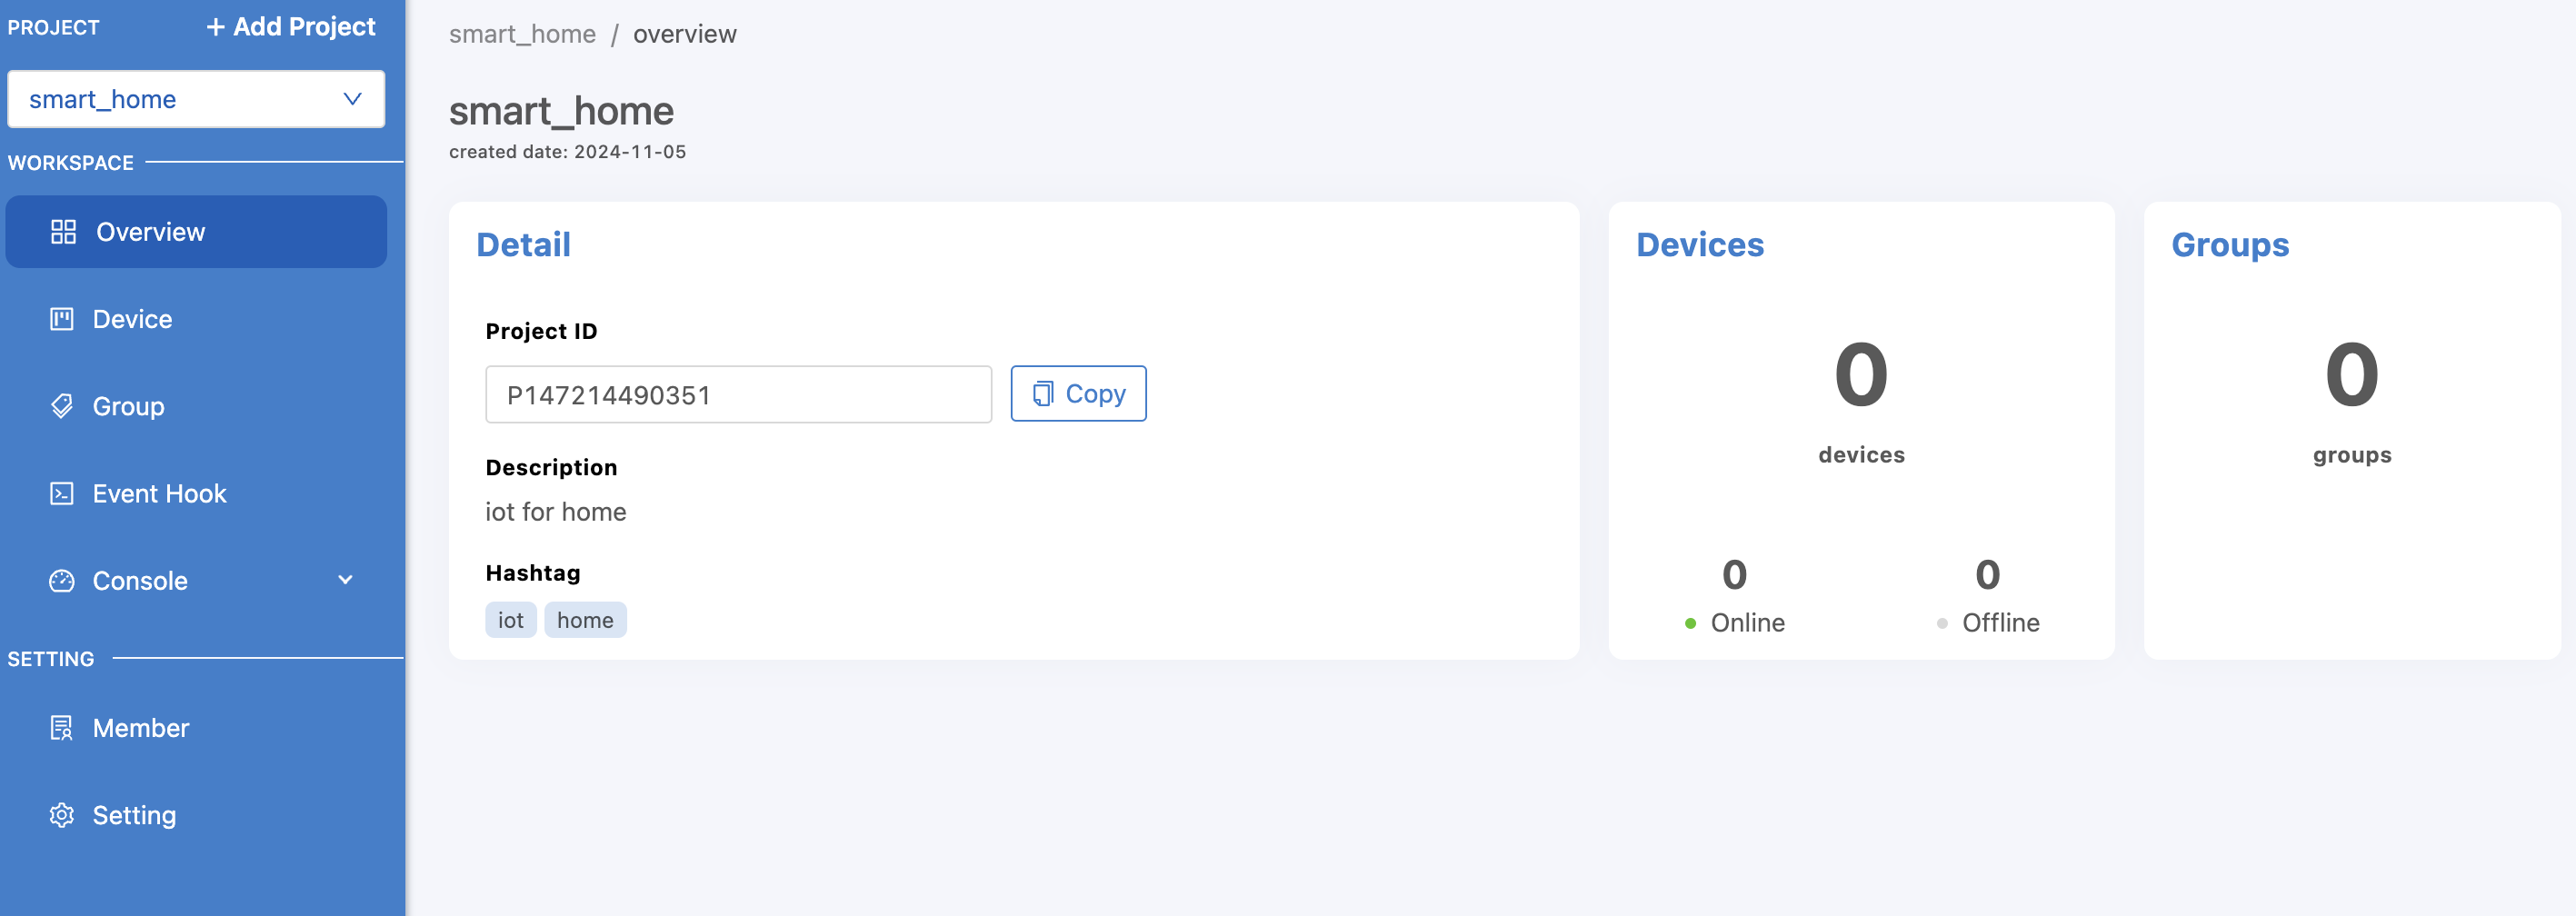
From the image above, the top left menu bar can be clicked to create a new project by clicking on the "+ Add Project" menu, which is similar to clicking on the "Create" button previously. You can also choose to change the project you want to manage by clicking on the dropdown next to it. If you want to edit general information or delete a project, see more details at Setting
Device
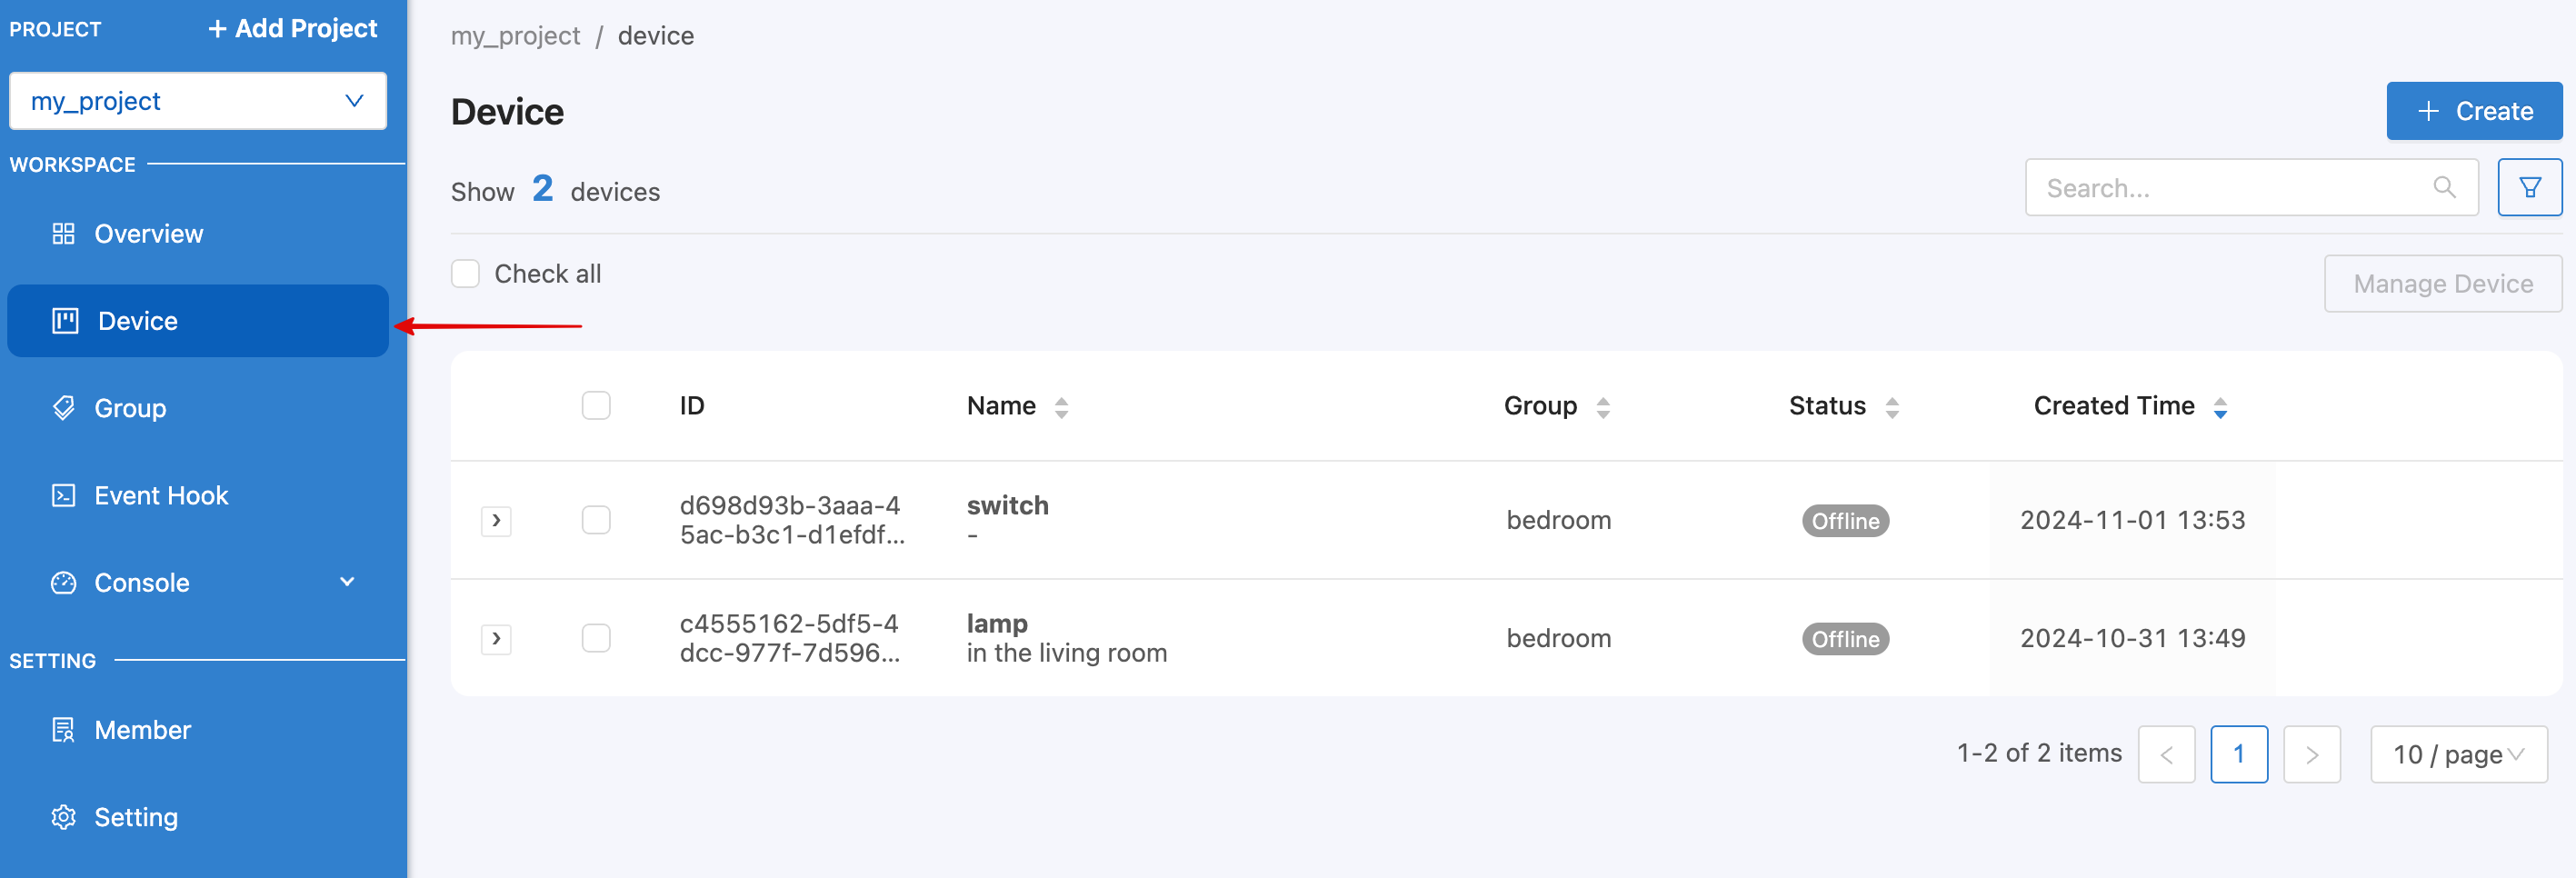
All devices must be under the Project. To manage device information, click on the "Device" menu in the left menu bar, and a screen will appear showing all devices created under that Project (if any), as shown in the figure.
From the image above, to create a new Device, click on the "Create" button in the upper right corner. When clicked, a form will appear for filling in information as shown in the image.
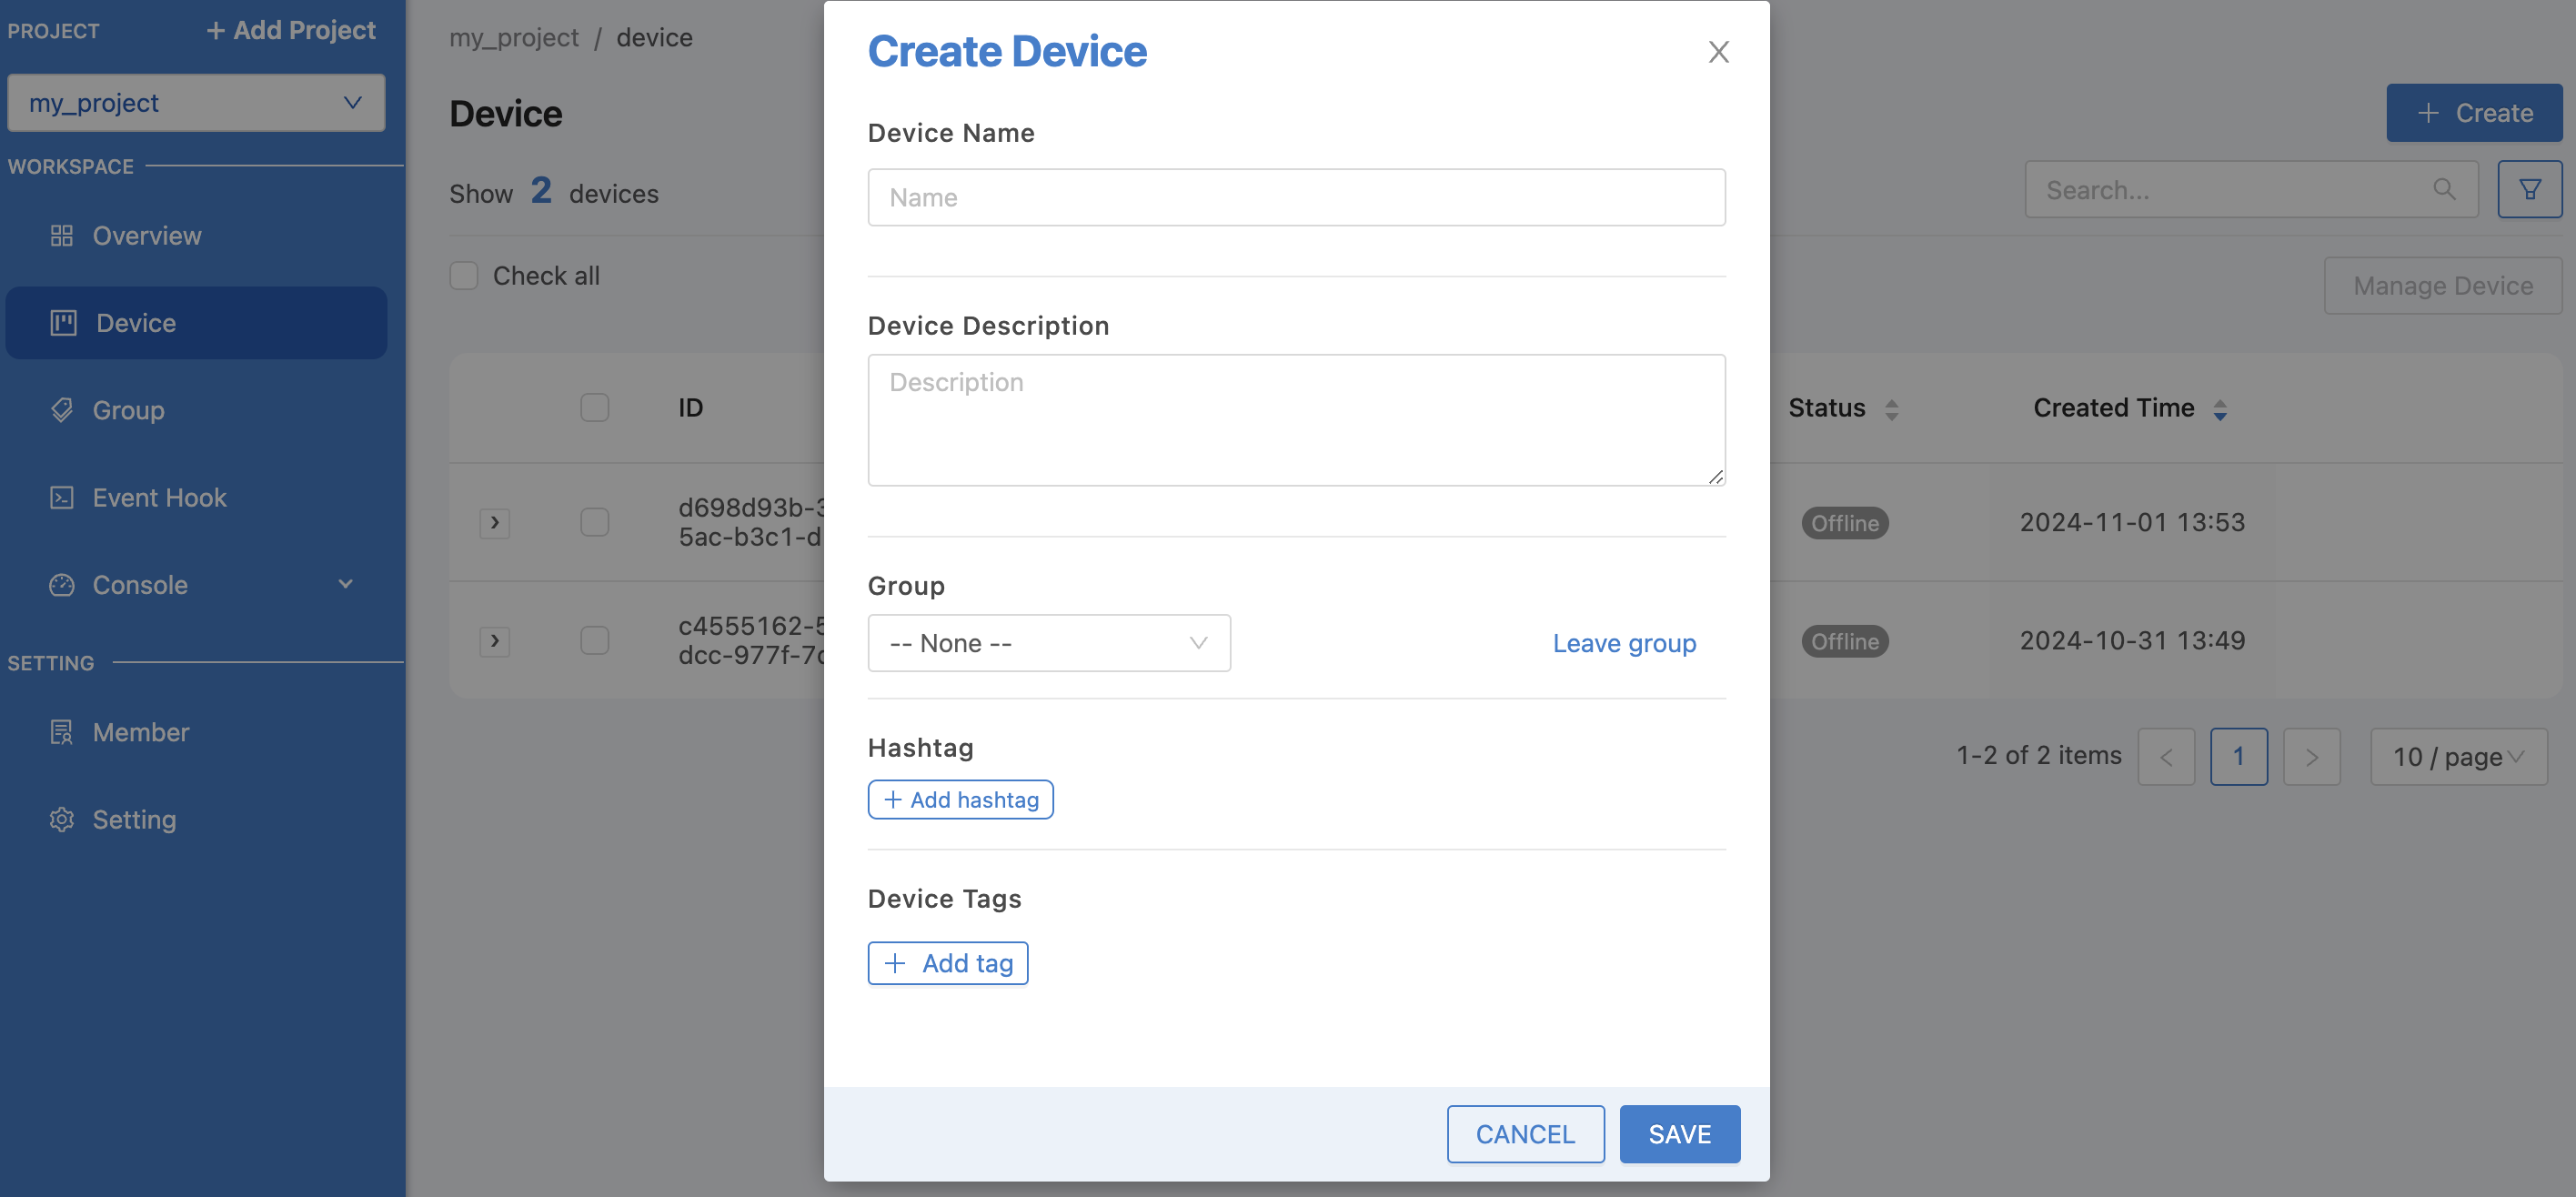
From the image above, the device information that can be identified is as follows:
Device Name |
Device names do not allow white spaces in the name. |
Device Description |
Device Description |
Group |
Group that you want the Device to belong to ("Leave group" at the back is used to clear the value in the Dropdown or you can change it to "None" in the Dropdown. If there is no data in the Dropdown to select, you can create a Group at Group) |
Hashtag |
Keywords are used to filter data. |
Device Tags |
Key-Value is used to filter data. |
When you have filled in all the information, click on the "SAVE" button. The newly created Device will appear on the top list, as shown in the figure.
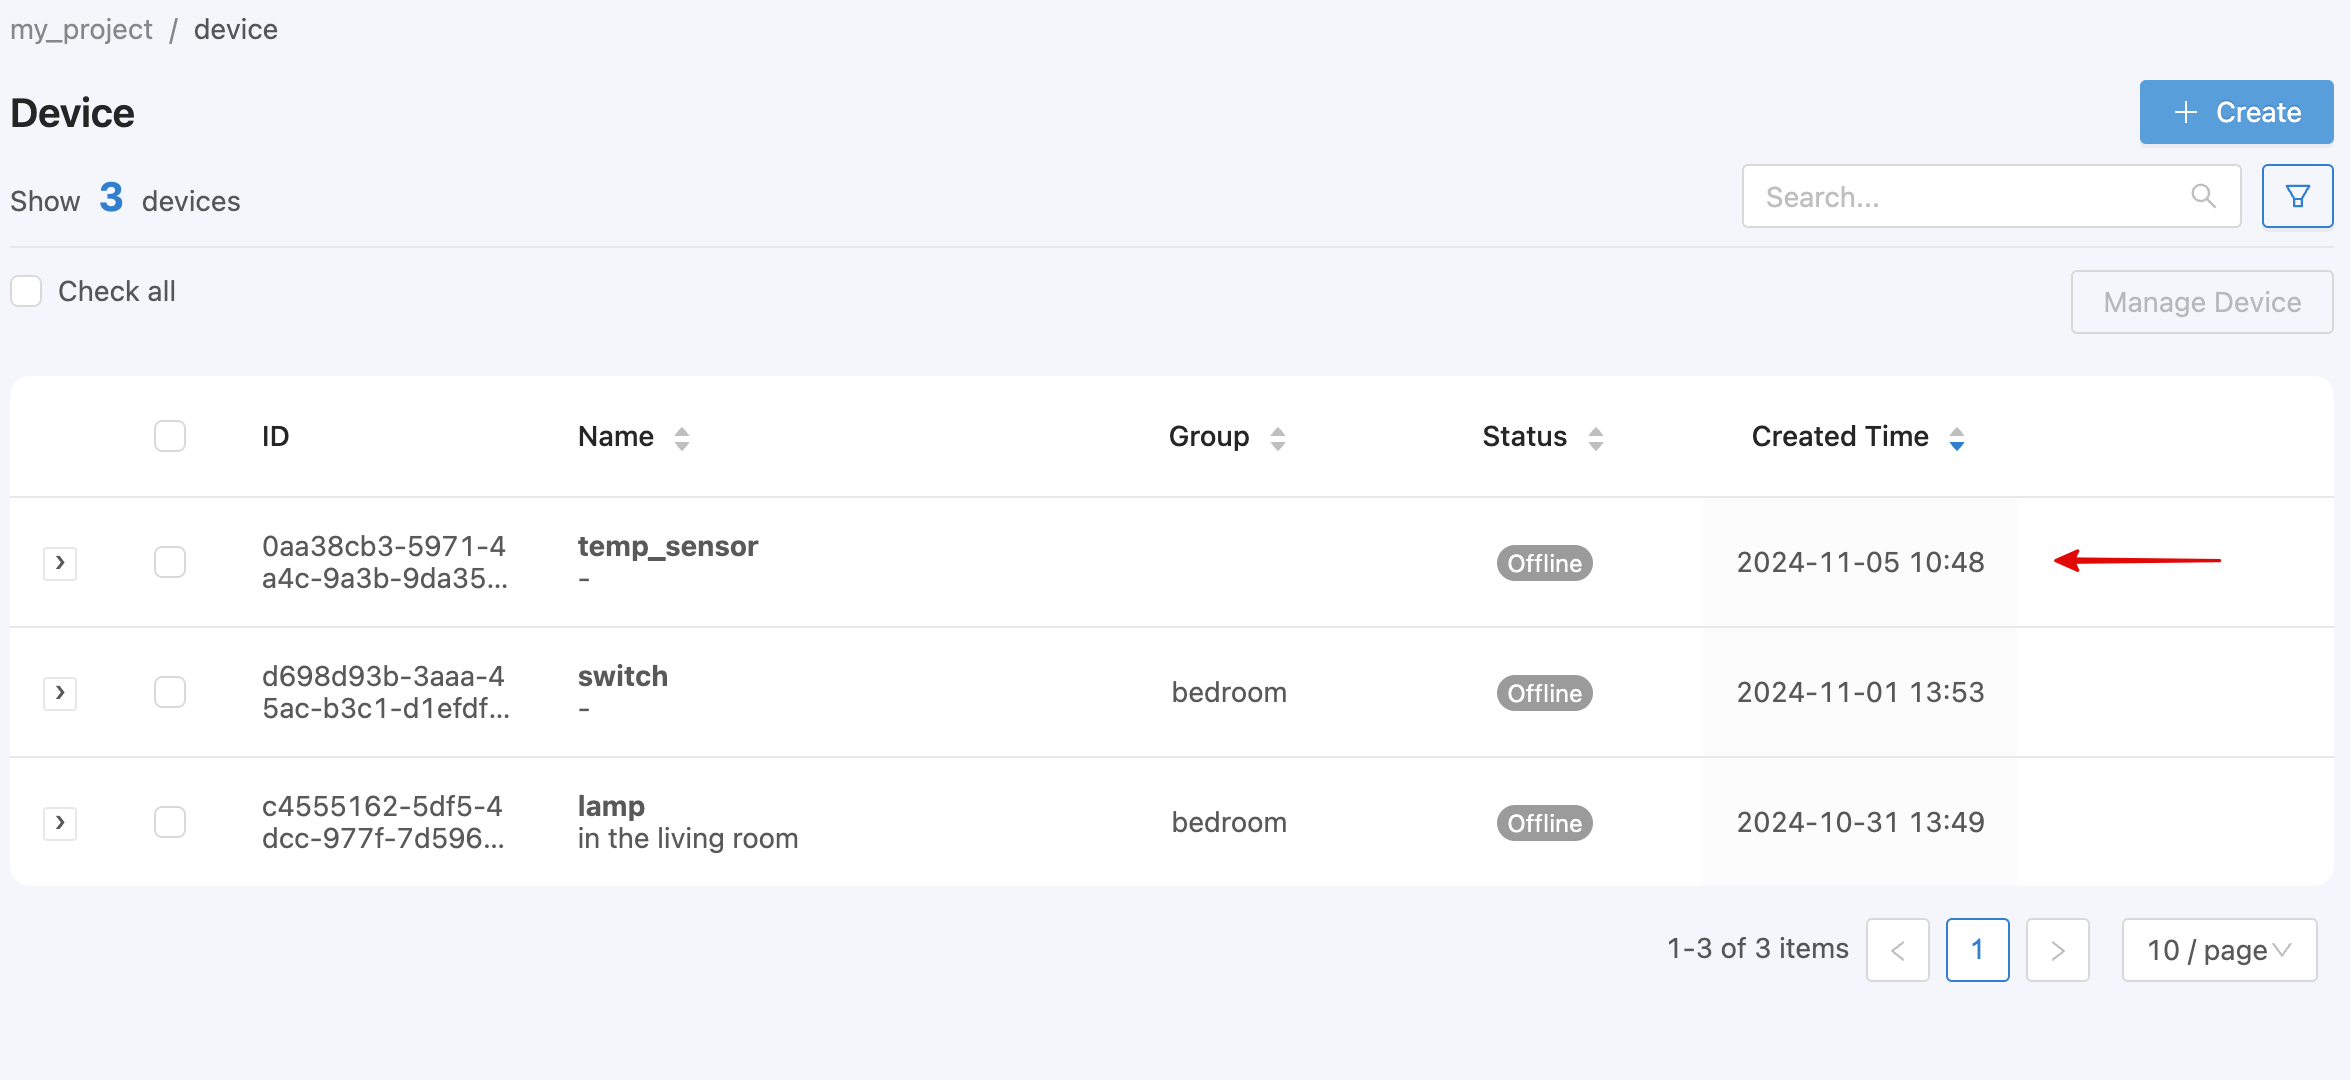
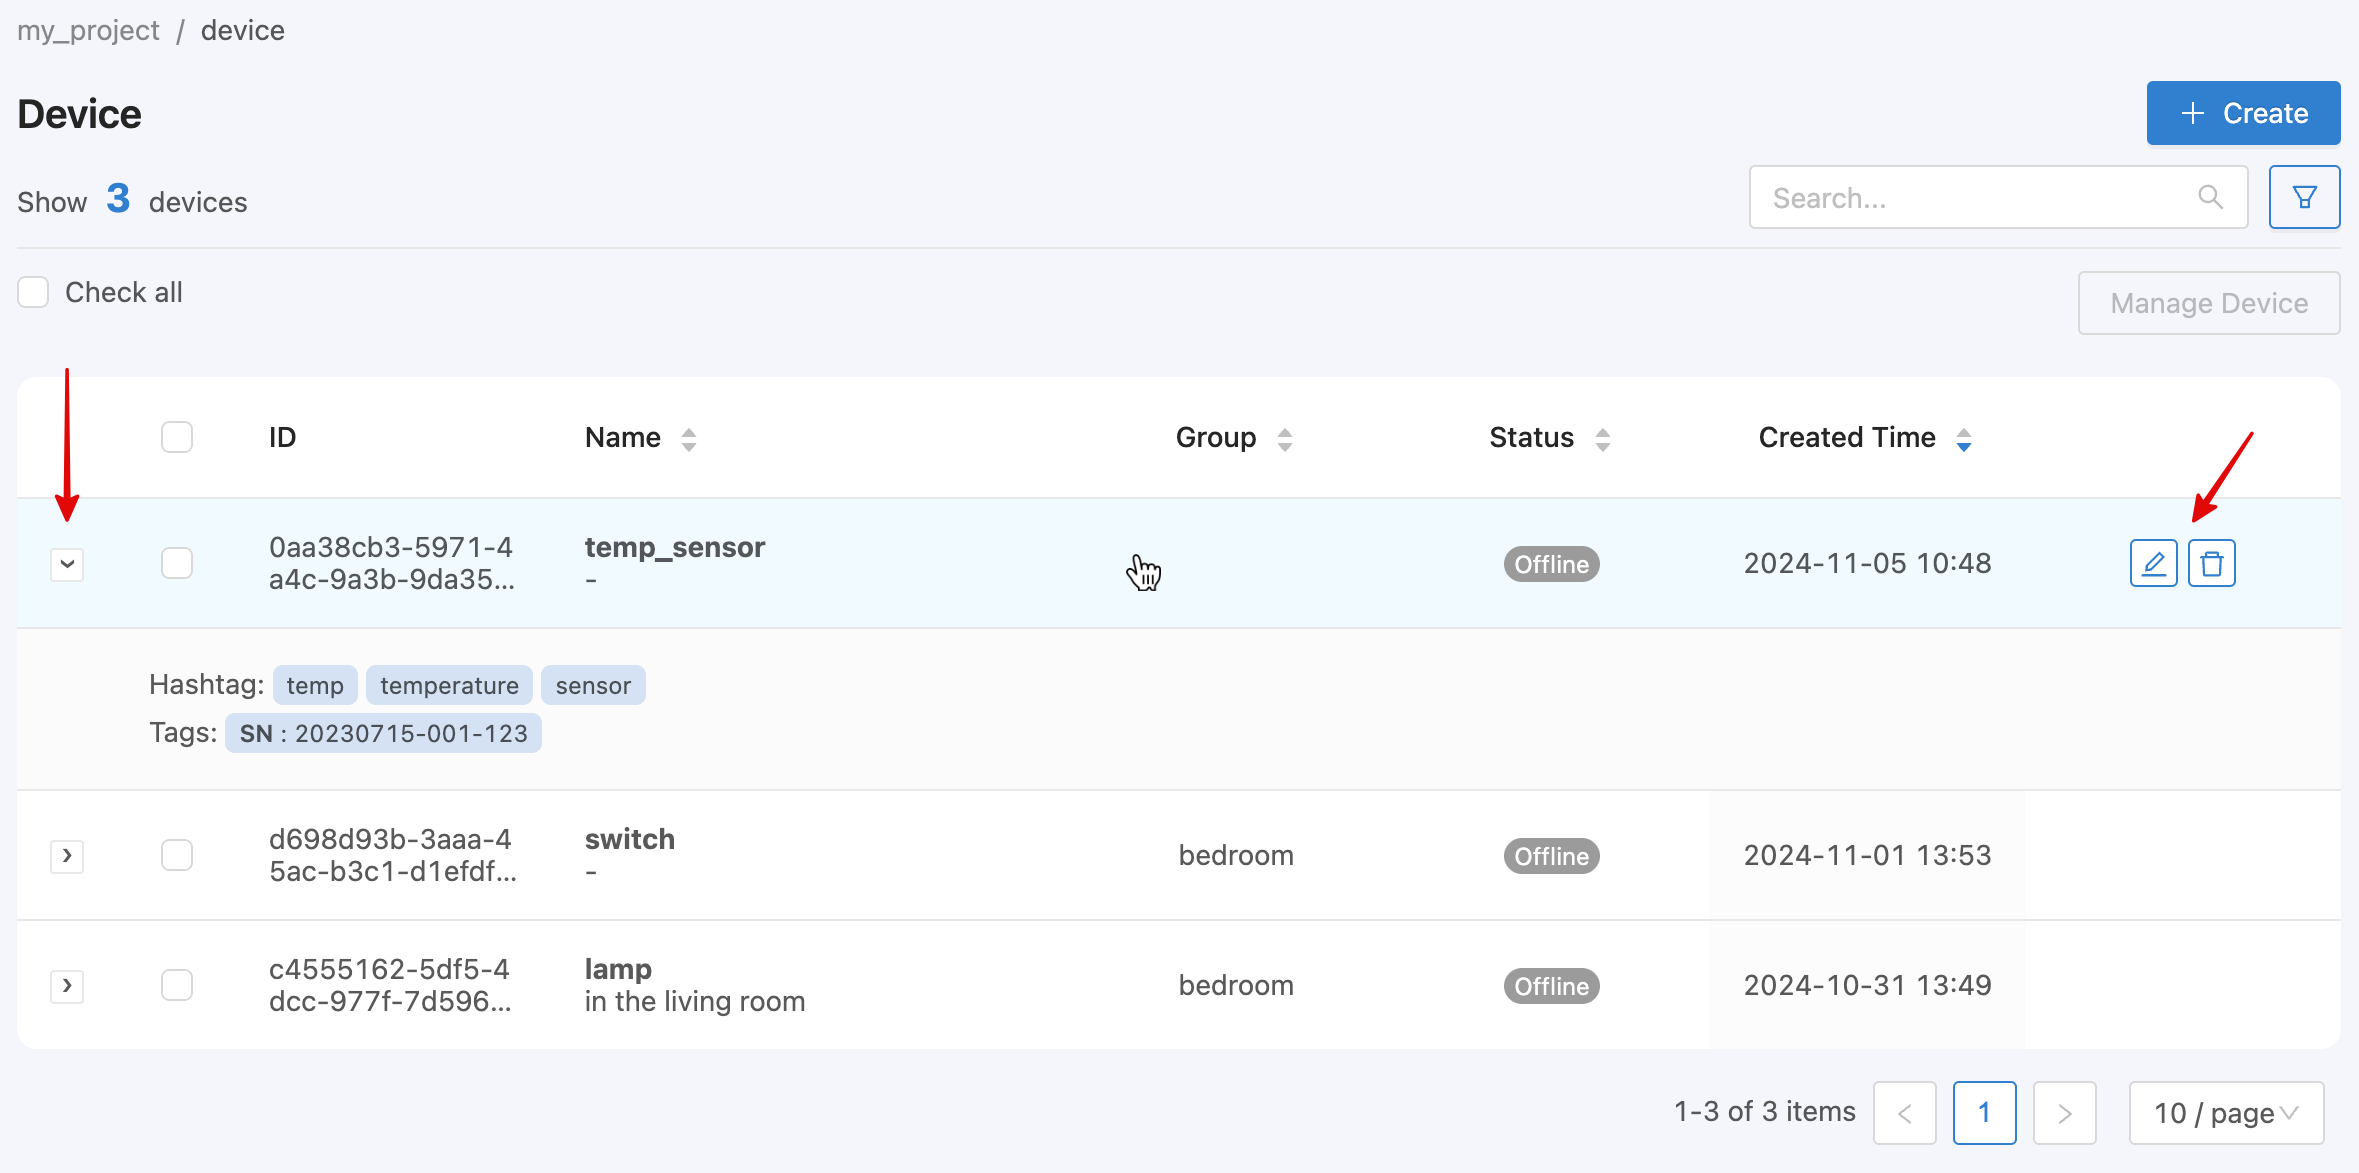
From the image above, you can see that there is still some hidden Device information (Hashtag, Device Tags). Click the ">" button in front of each Device that you want to see the hidden information. When you point the cursor at any Device, an icon will appear for you to click to edit or delete the Device information, as shown in the image.
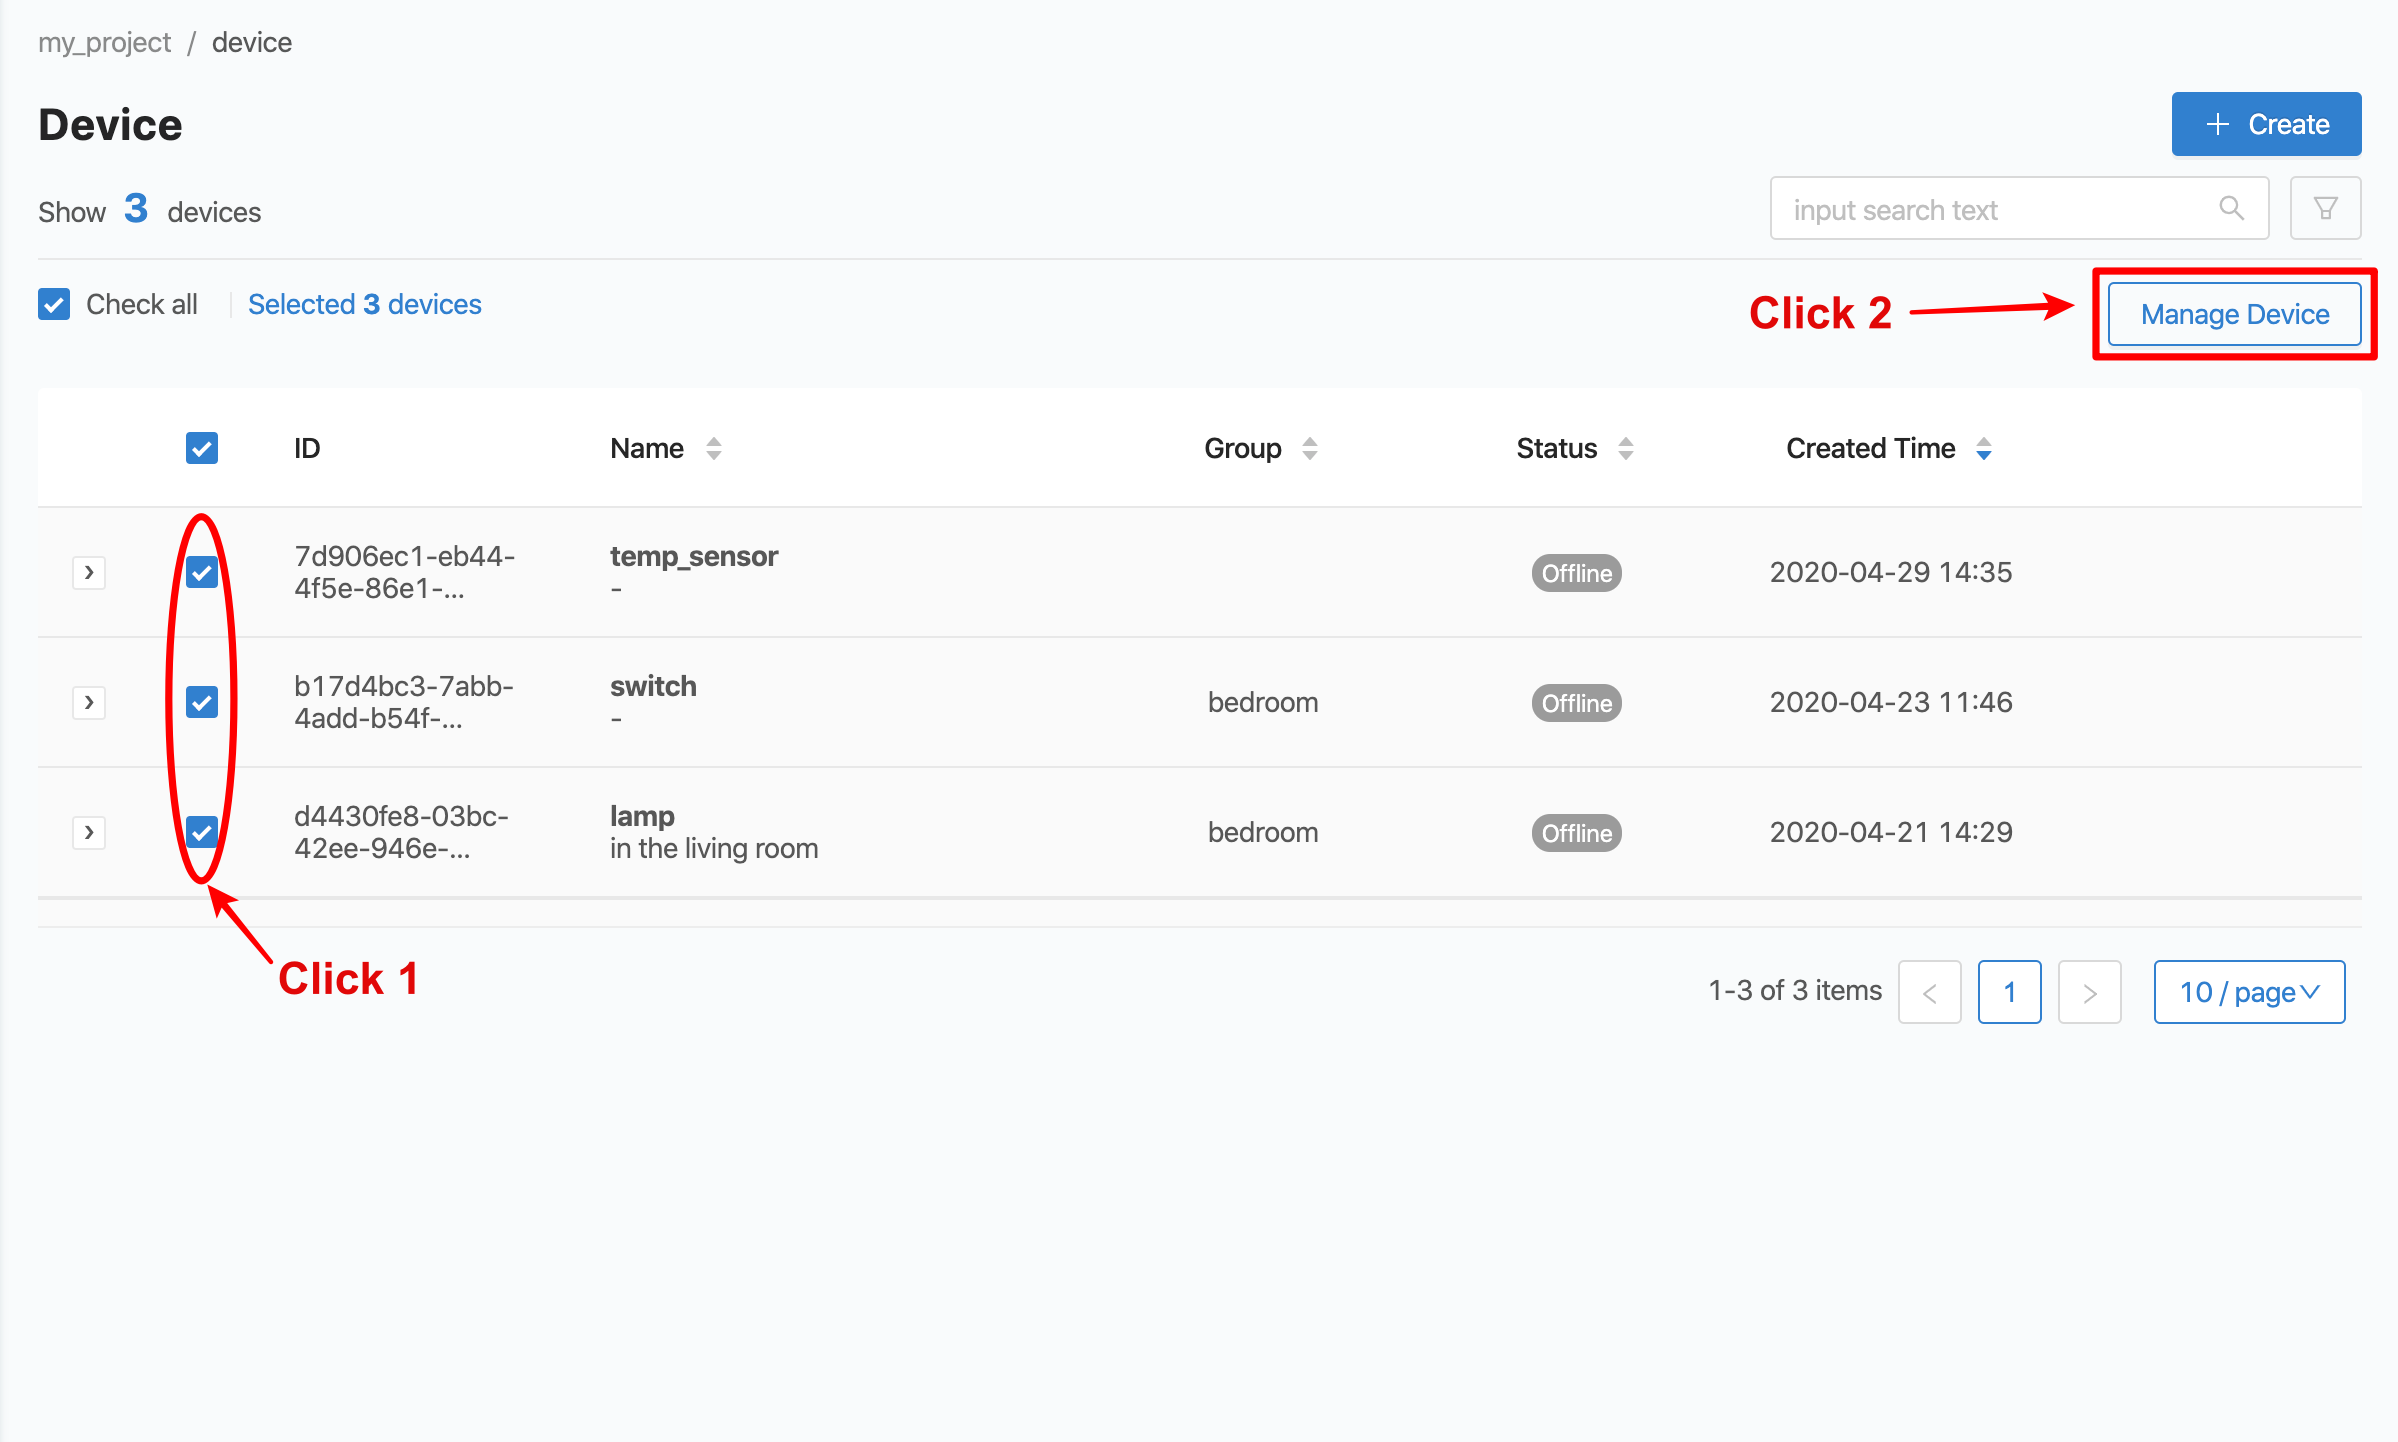
the "Manage Device" button on the top right corner, it is used to manage the Group for the Device. It is possible to organize multiple Devcie Devices into a Group at once. You do not have to do it one device at a time like the edit screen. To use it, start by clicking on the Checkbox in front of the list of Devices that you want to organize into the same Group at least 1 Device. Then the "Manage Device" button will be Active so that you can click it, as shown in the picture.
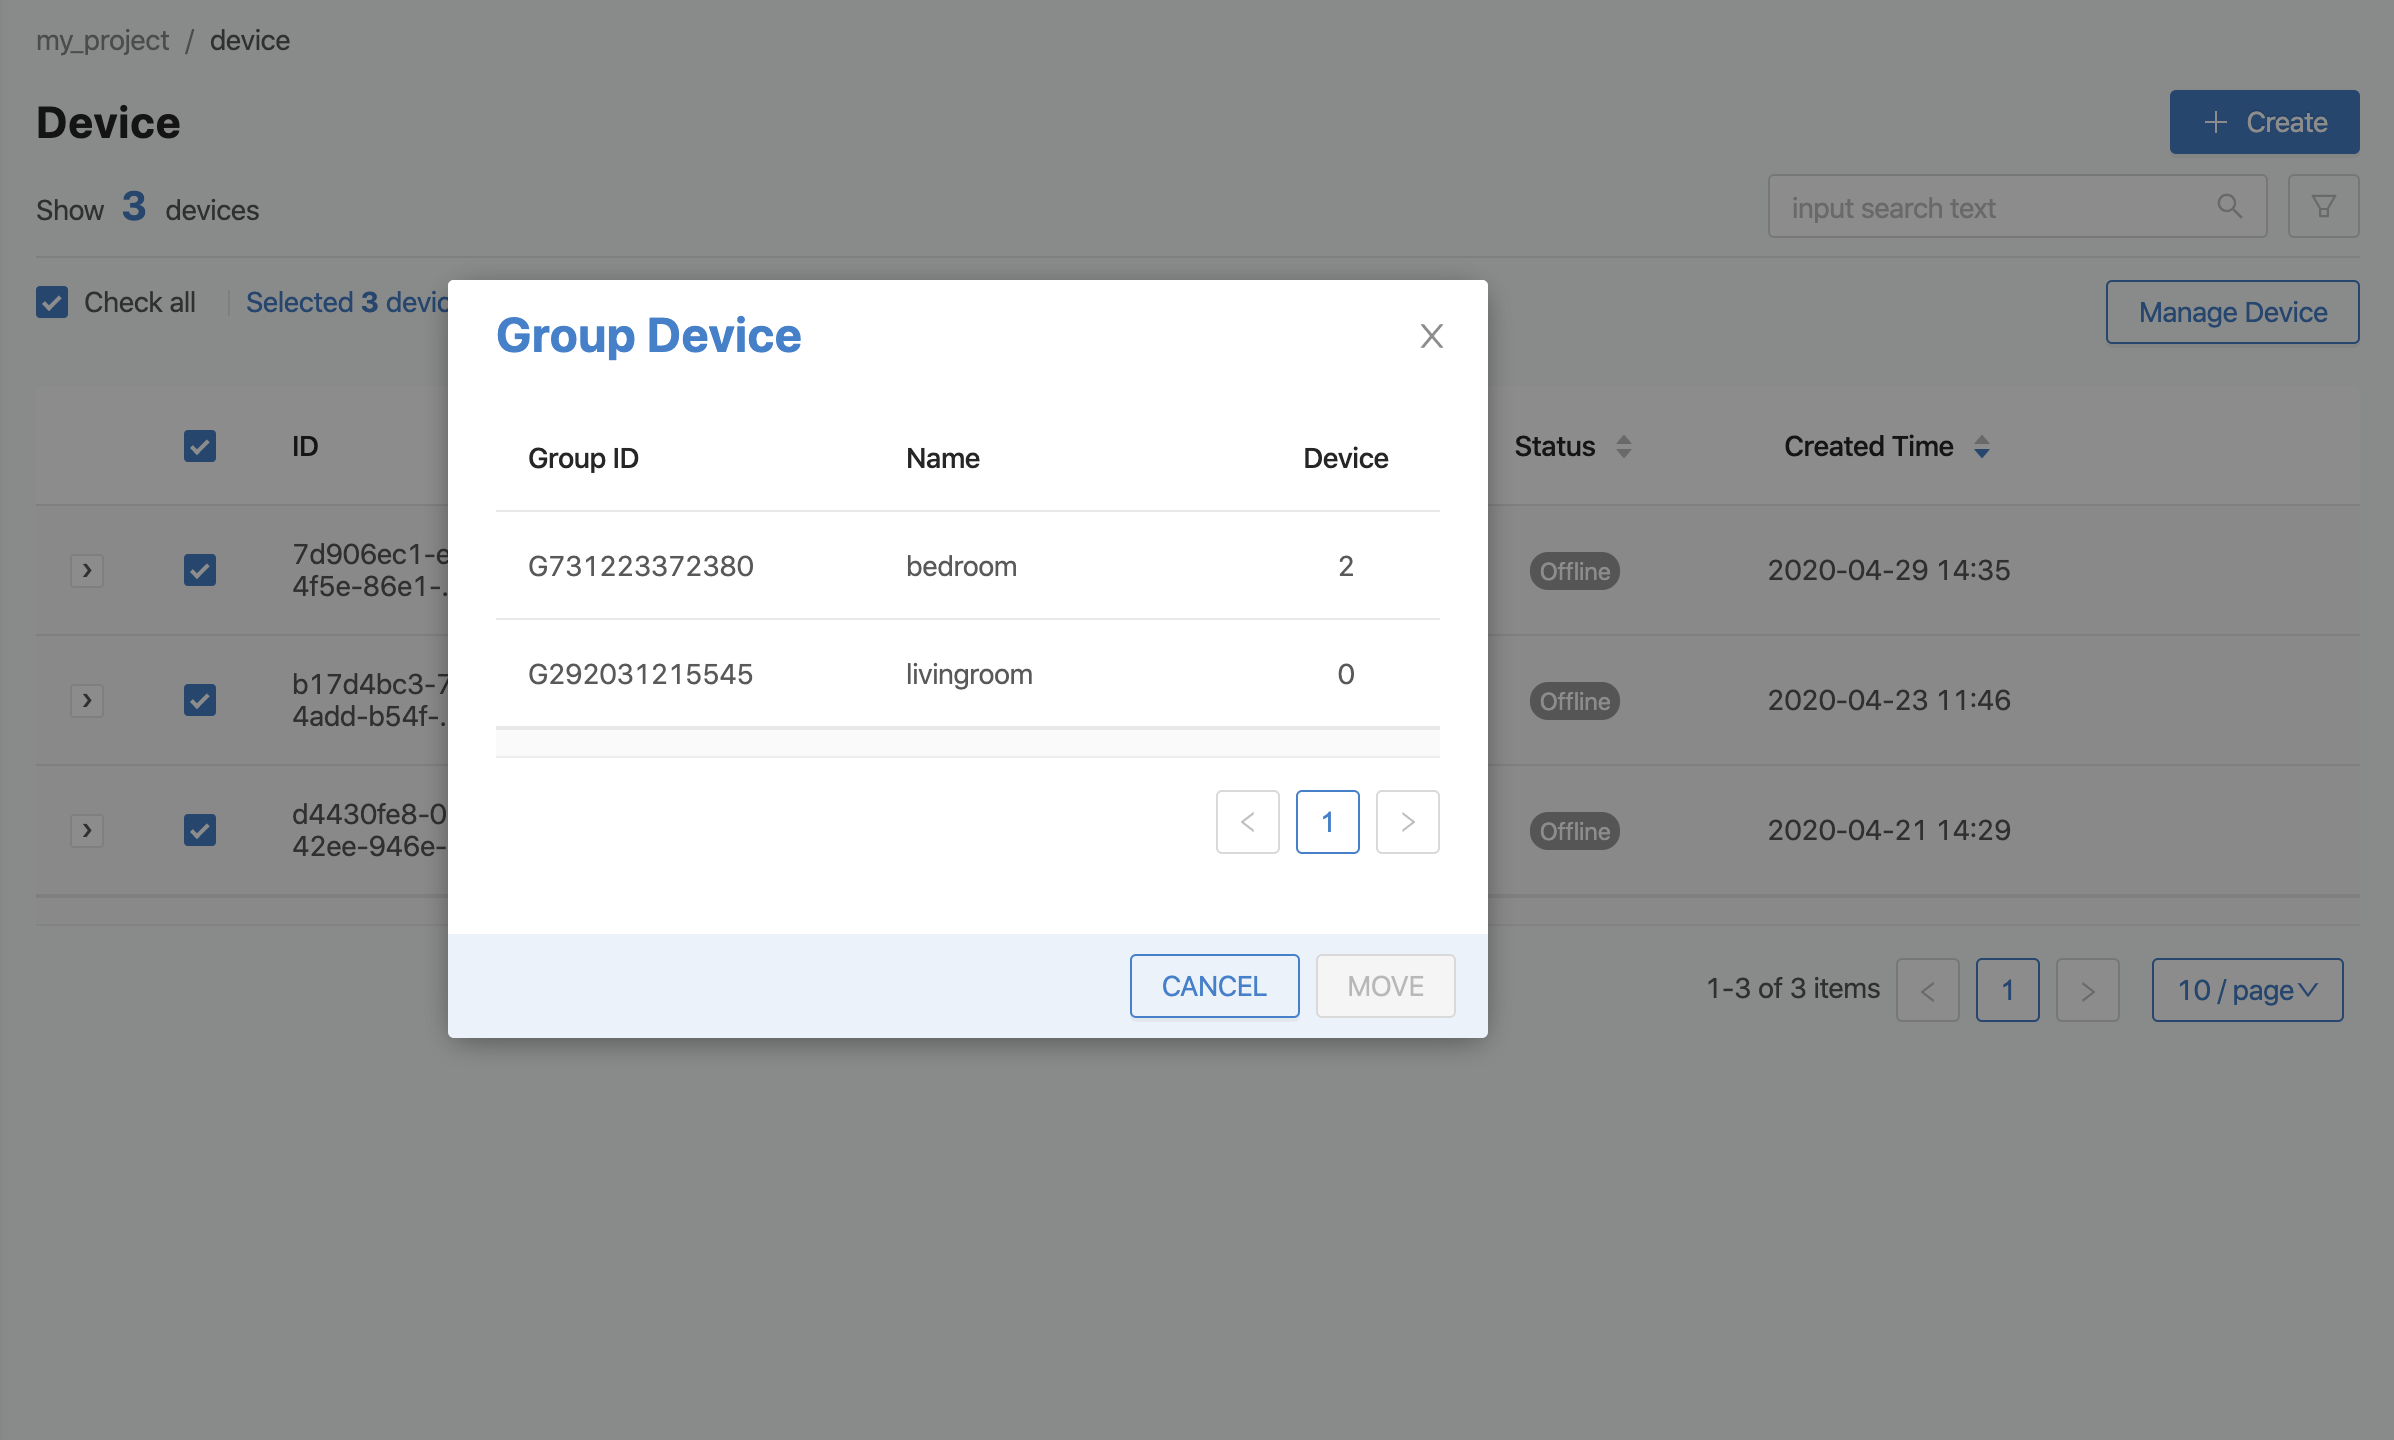
When the "Manage Device" button is Active, when clicked, a list of Groups will appear. Select to organize the Device into that Group (if there is no Group list to select, you can create it in Group) as shown in the figure.
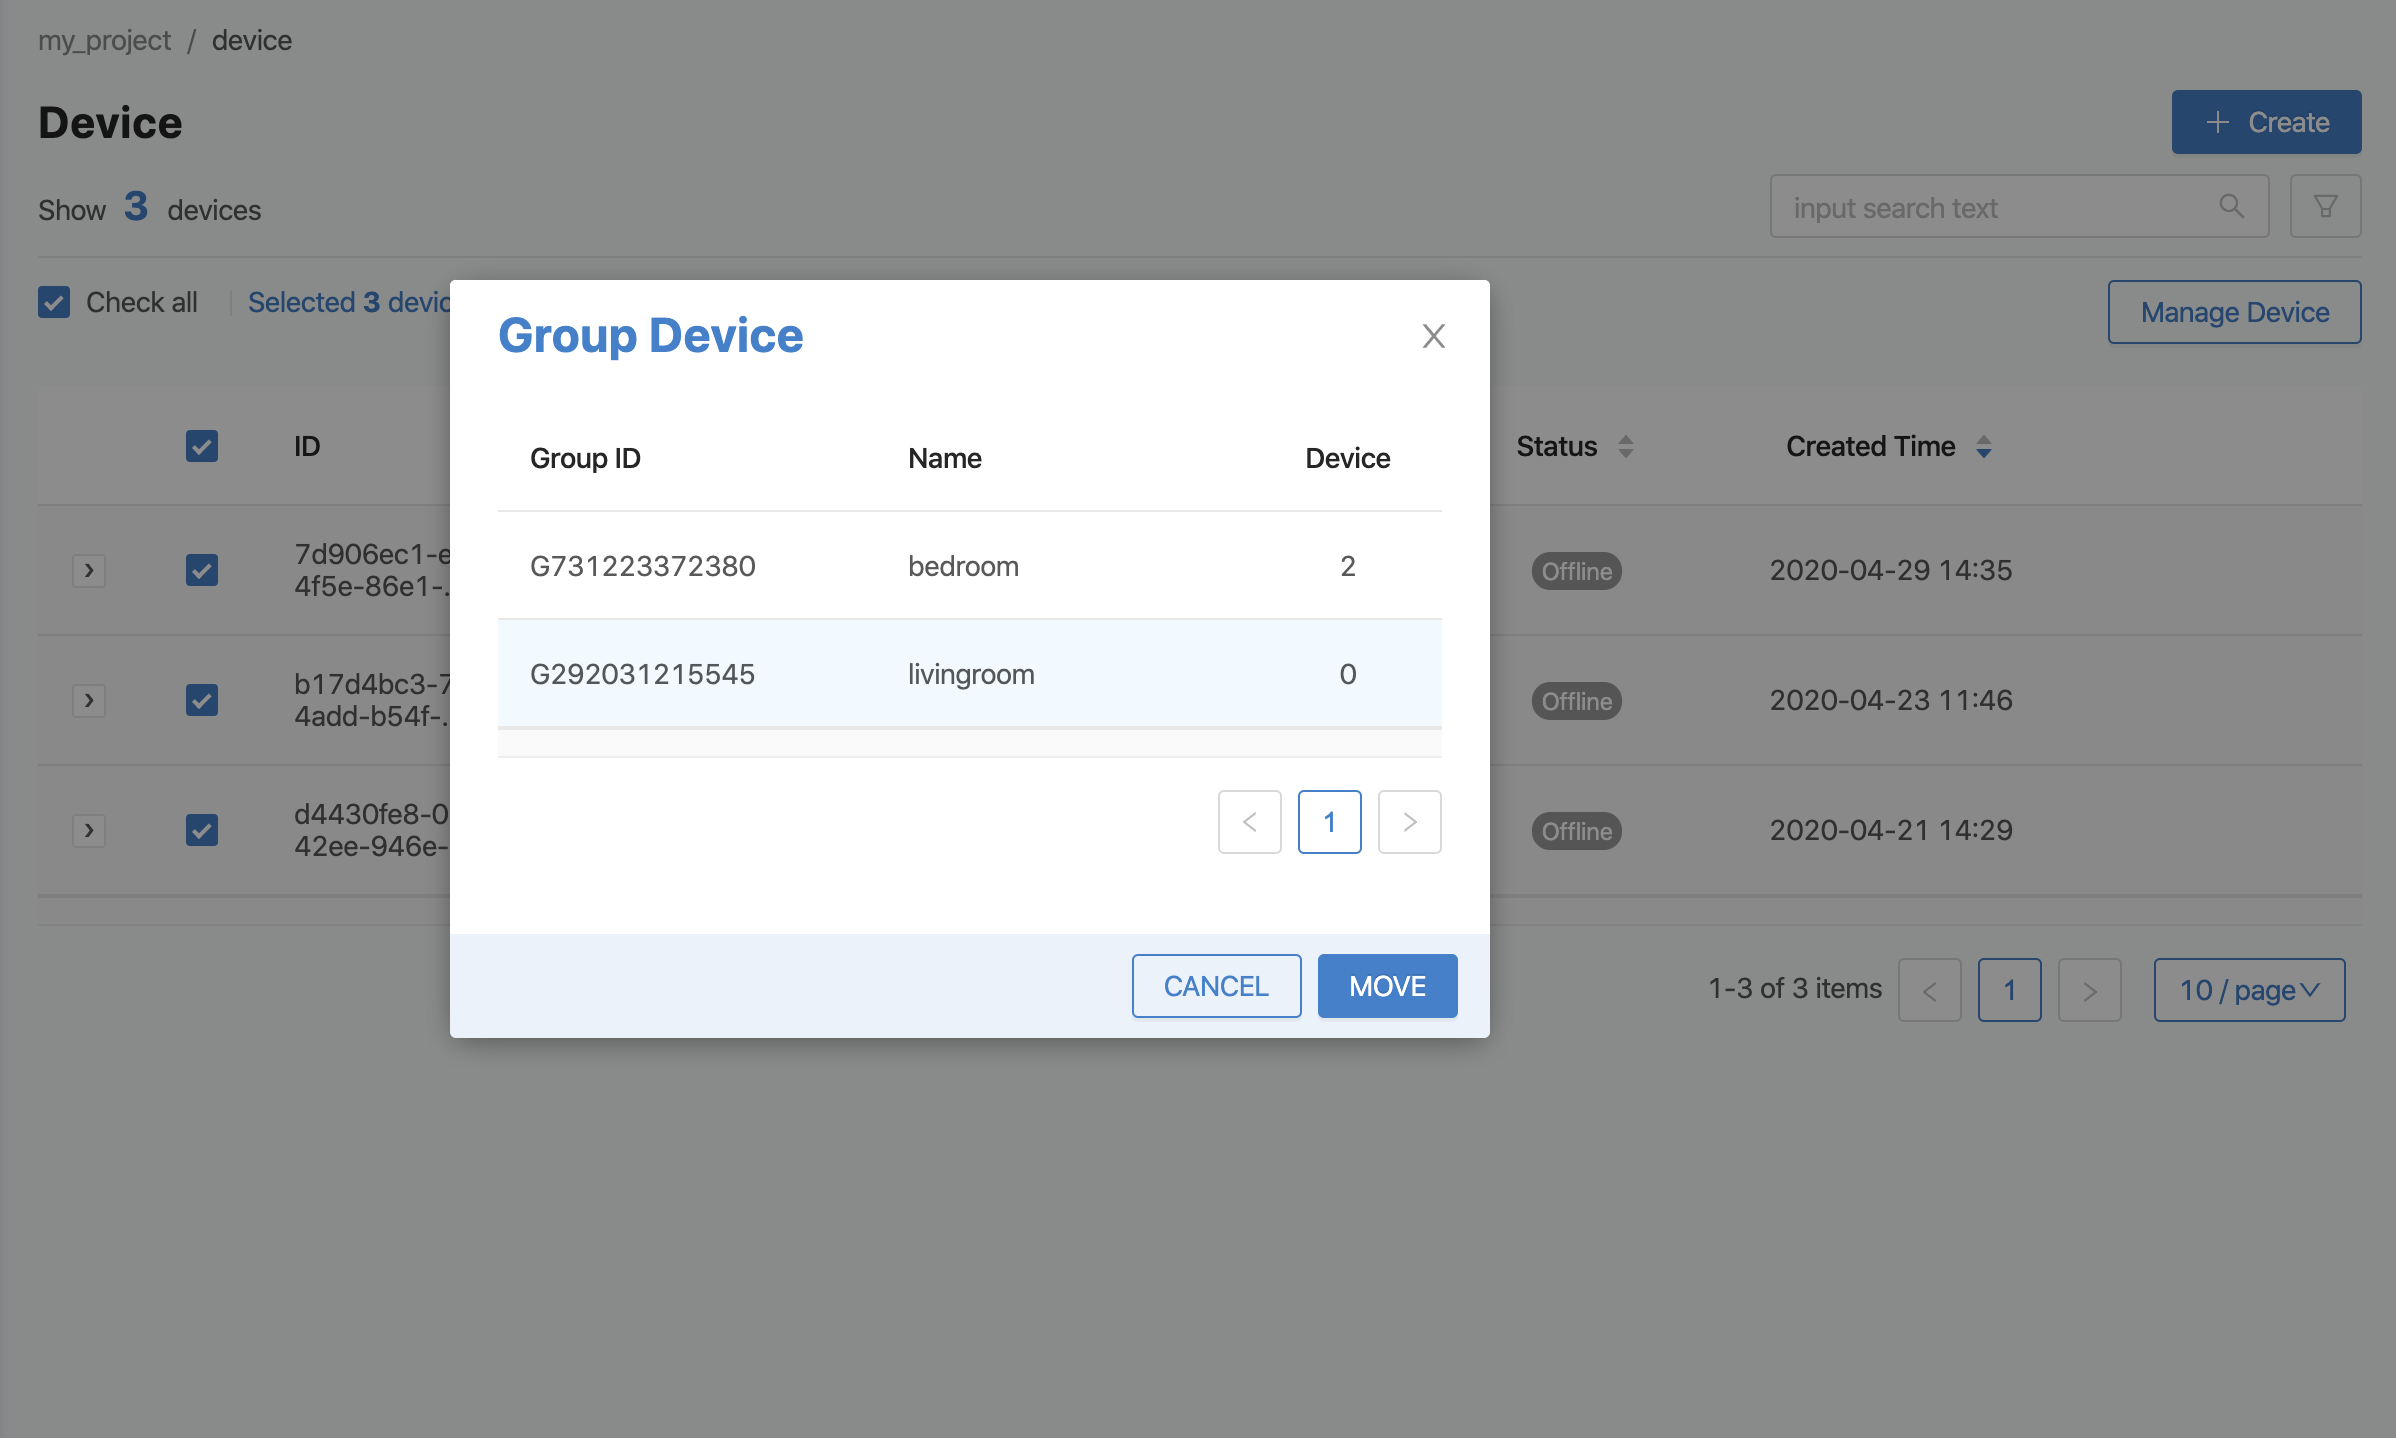
Then click to select the Group item that you want to organize the Devcie into. The selected Group will have a light blue bar and the "MOVE" button will be Active and clickable, as shown in the figure.
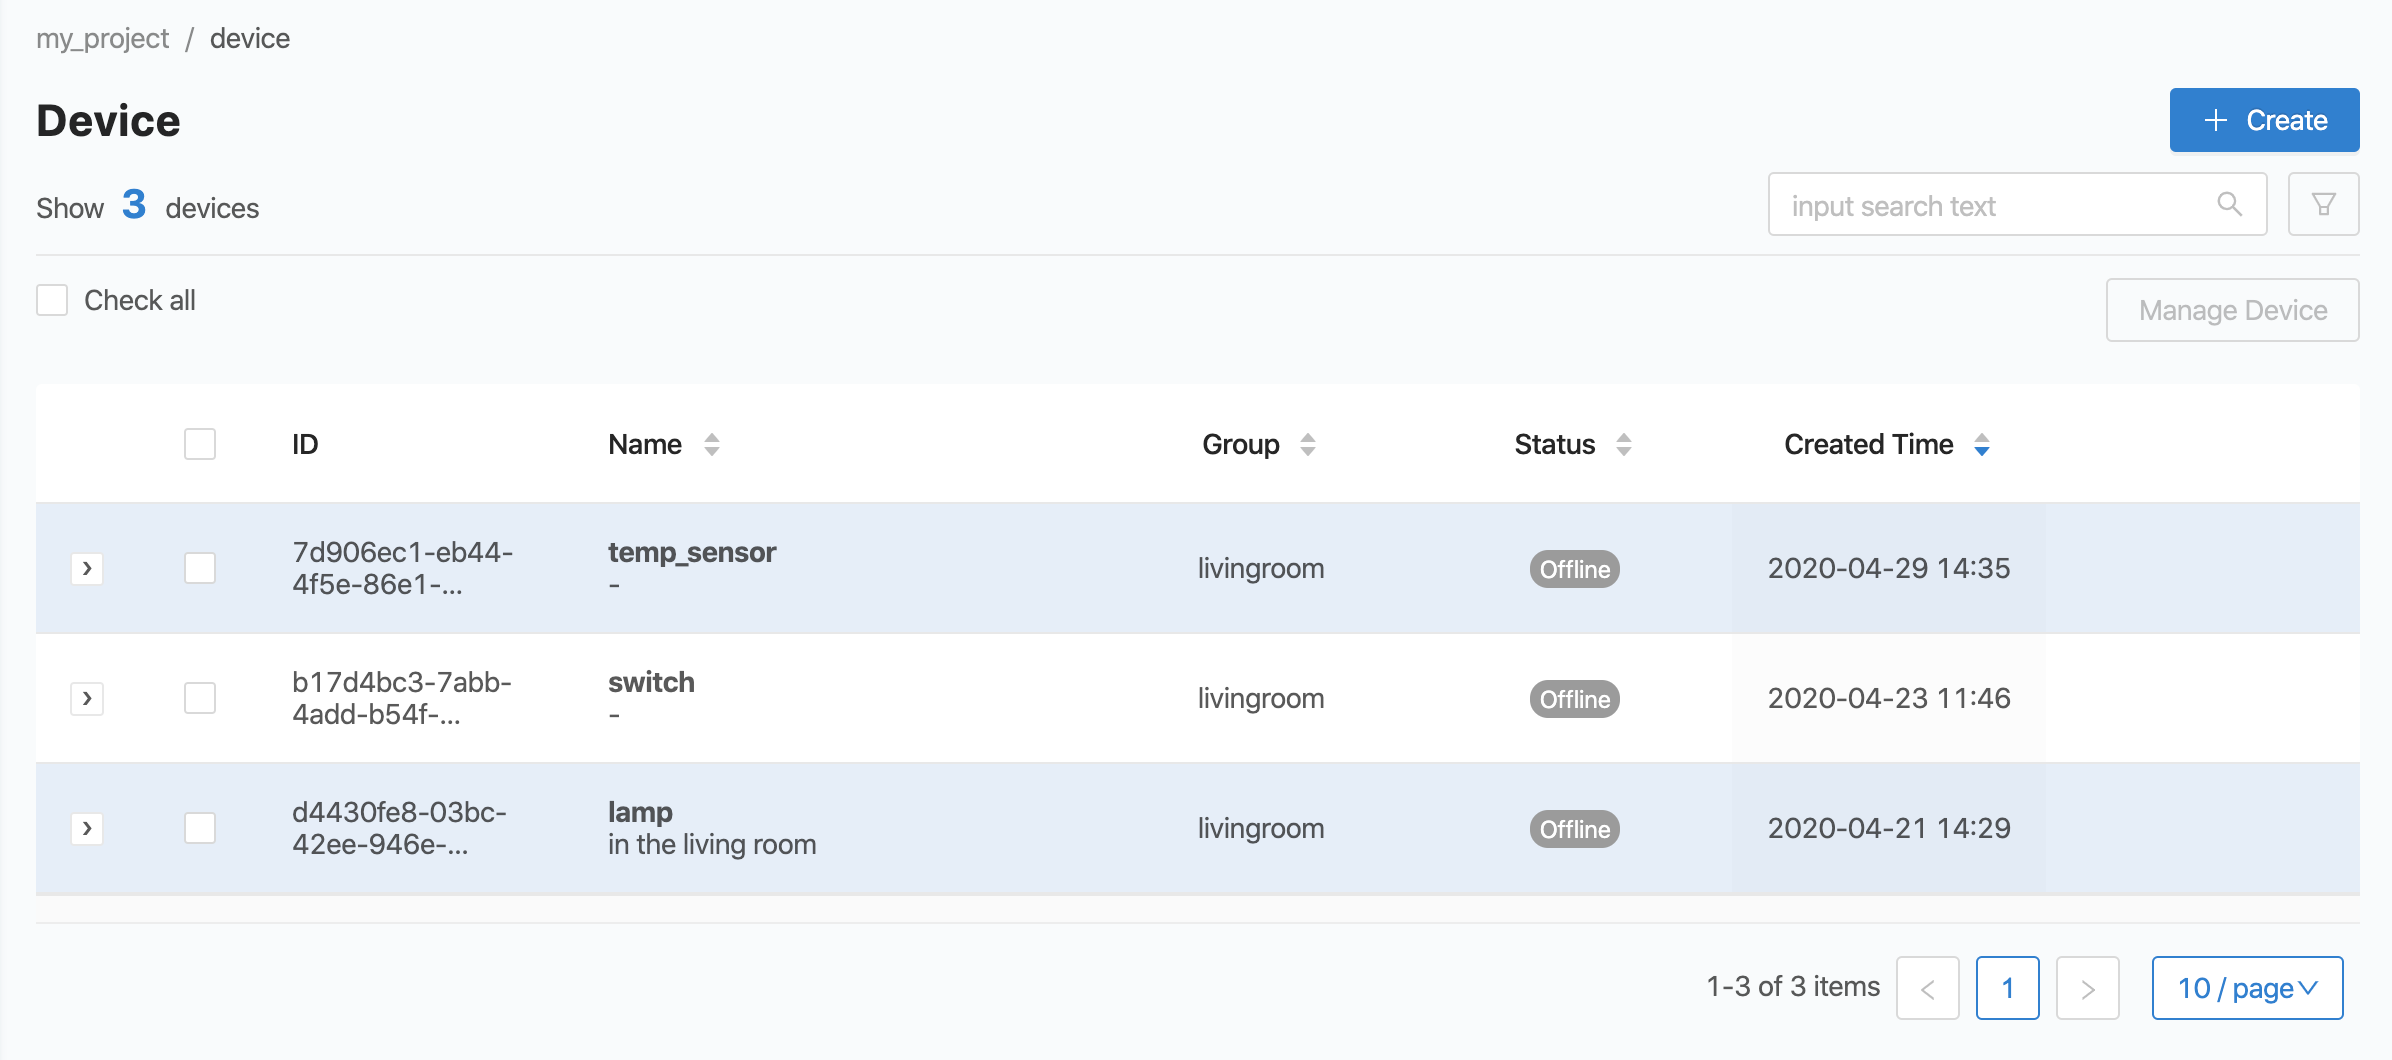
When you click on the "MOVE" button from the image above, the selected Device will be placed in the Group as selected, as shown in the image.
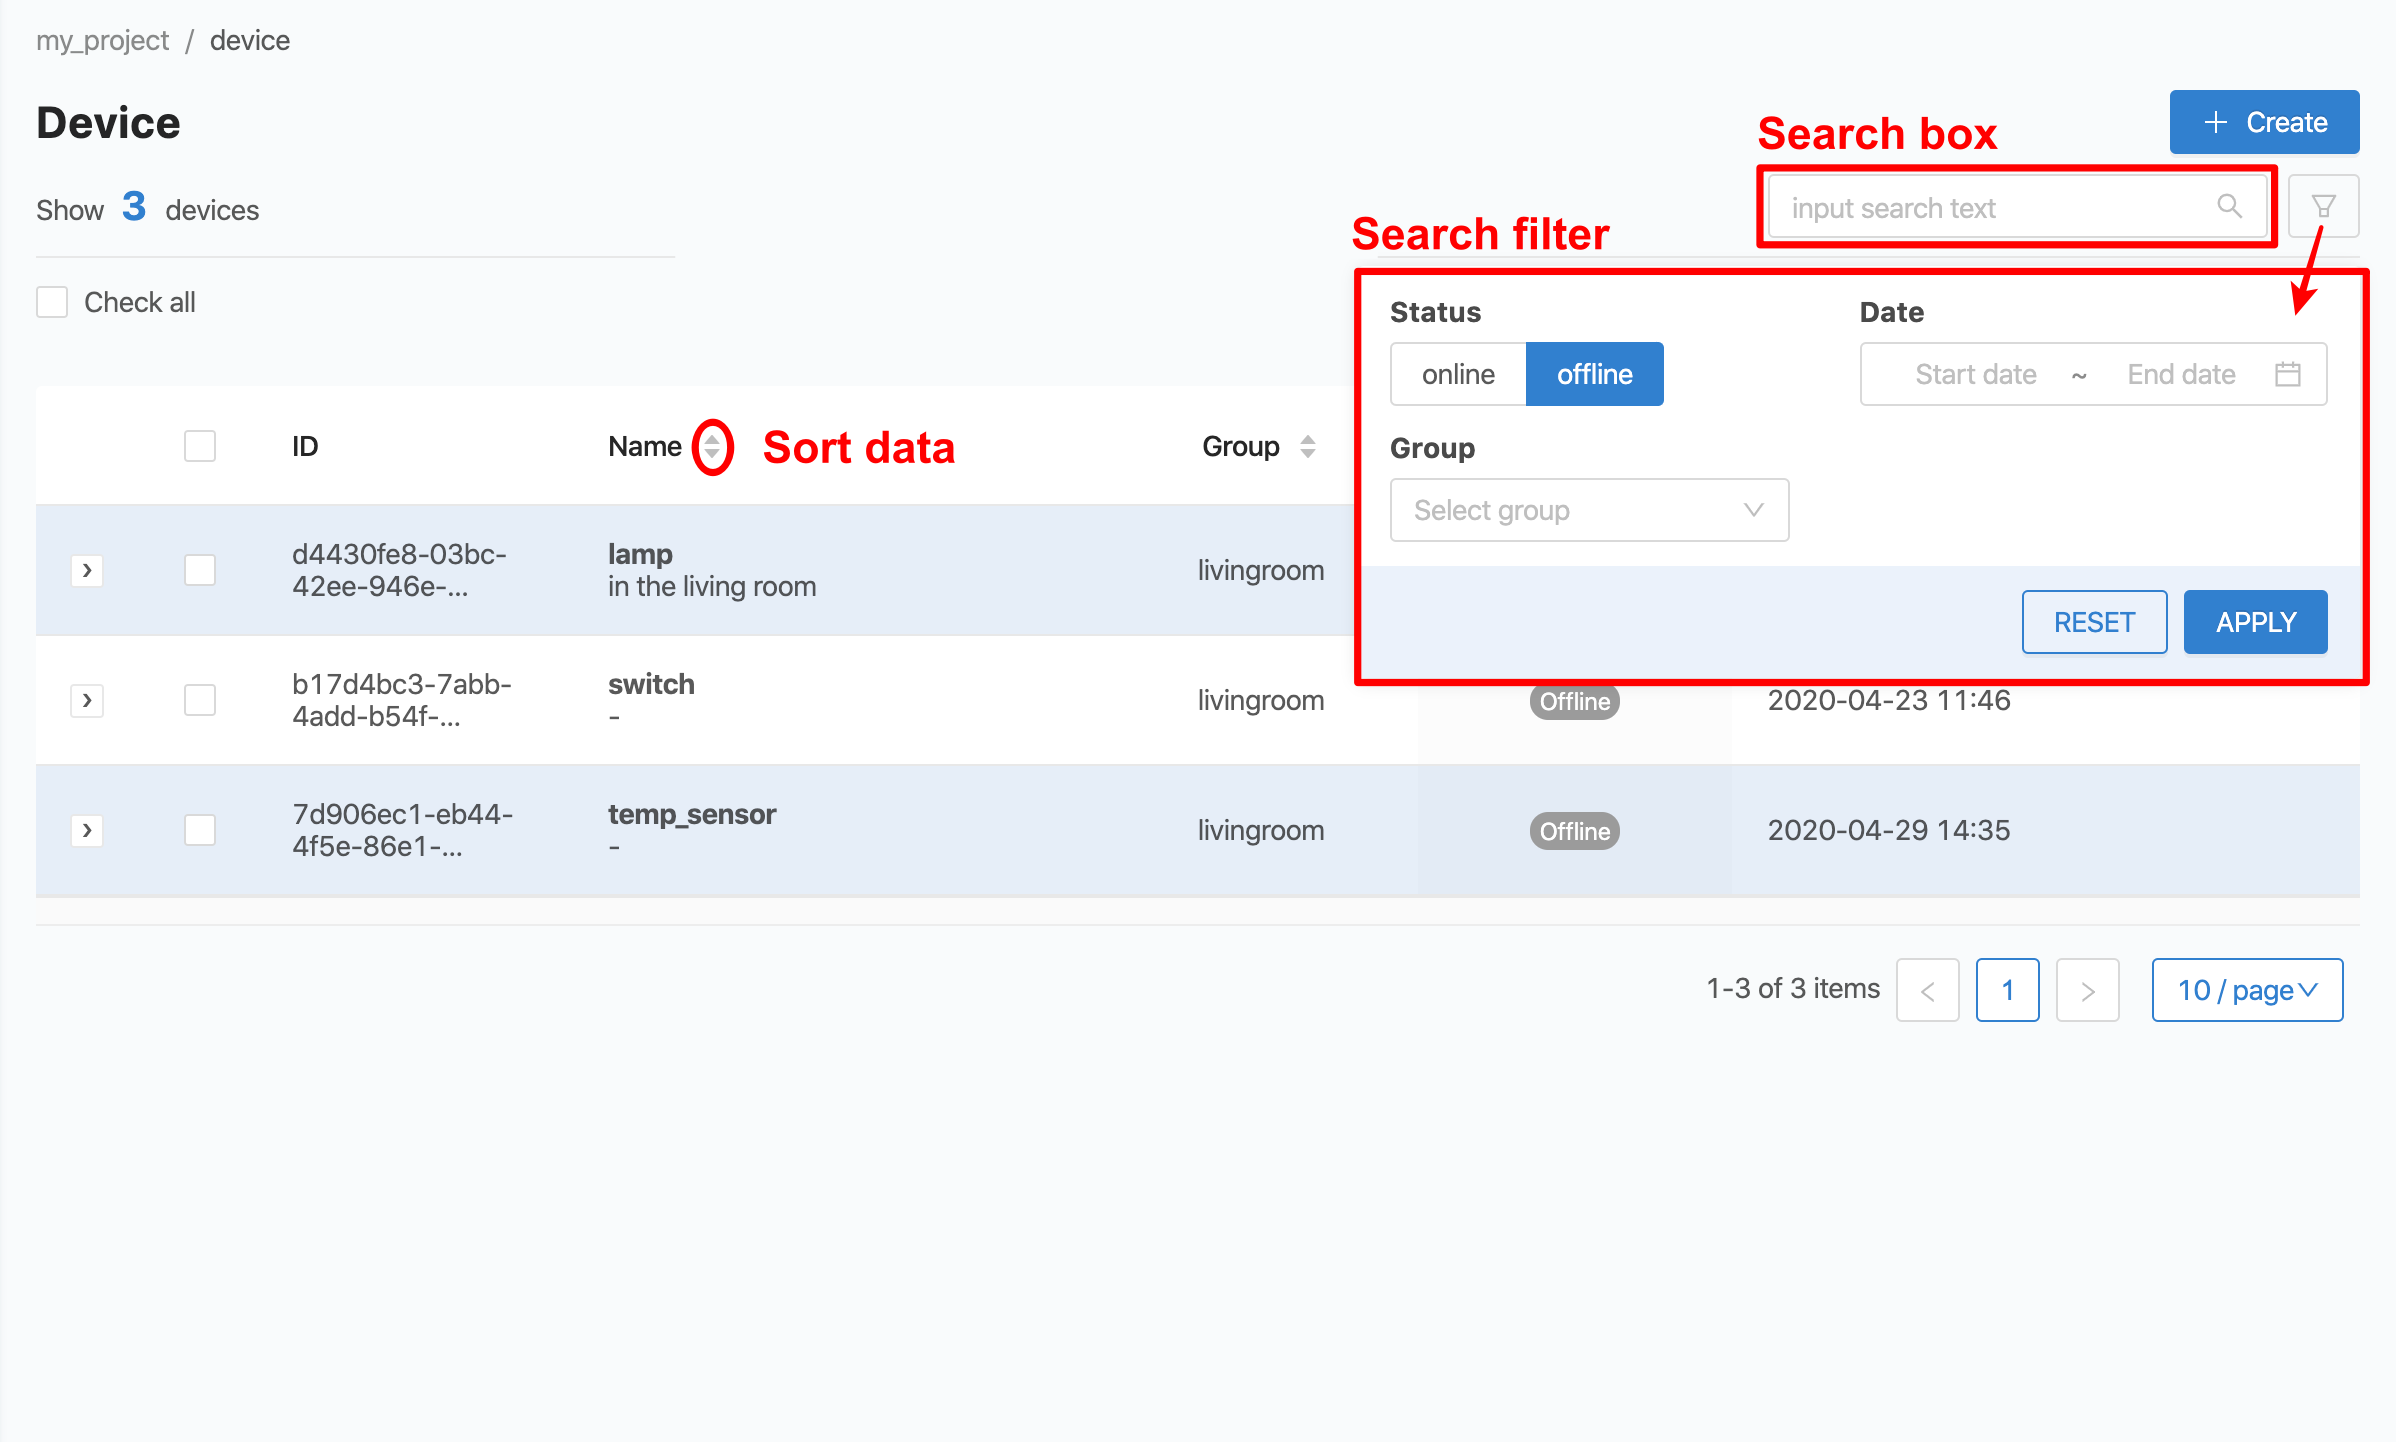
In addition, there are tools to help find Device information if there are many Device items, including a search box by entering the desired search term and clicking on the magnifying glass icon at the back or pressing "Enter" on the keyboard, or using the search filter provided by the system by clicking on the filter icon next to the search box. Filters will appear that users can choose to use to filter information, including:
Status is filtered by the device’s connection status to the platform (online connected, offline not connected).
Date is filtered from the date range of Device creation.
Group is filtered from the group that the device belongs to.
And the Devcie list table, where the column headers can be clicked to sort data by data type, as shown in the figure.
If you click on each Device item, you will be able to view details and set various device information. When you click, the screen as shown in the picture will appear.
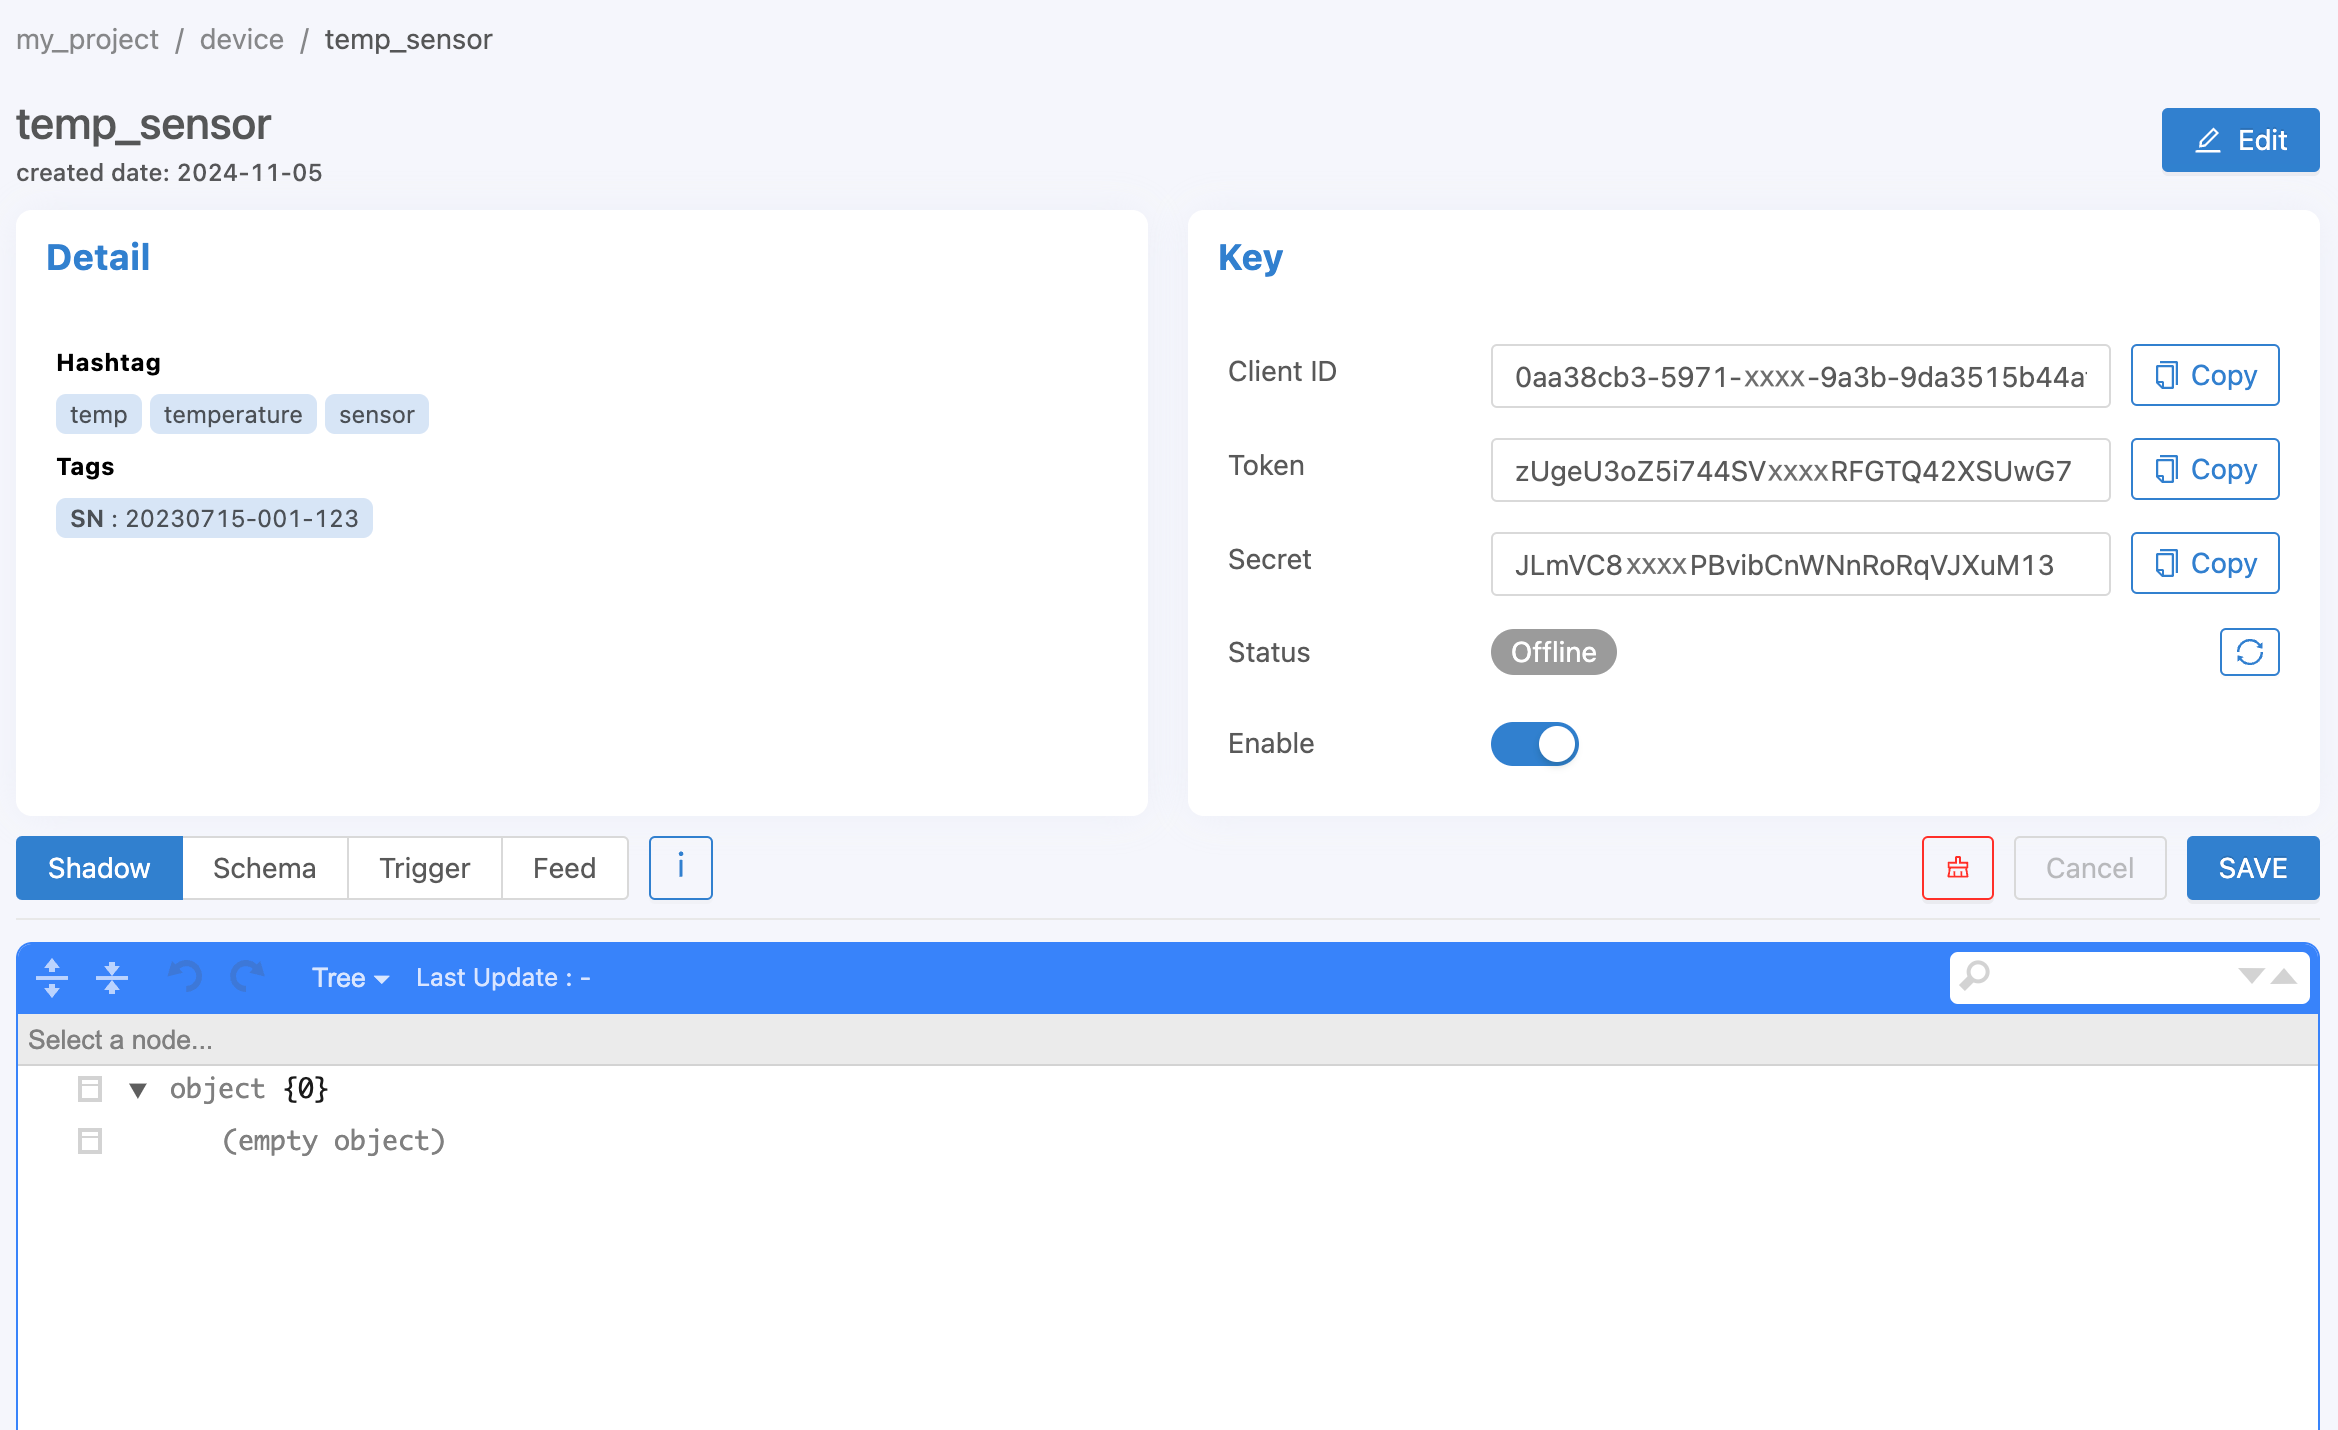
From the image above, the information in the top left corner shows the name of the device and the date the device was created. In the top right corner, there is an "Edit" button. When clicked, a form will appear for editing general information of the device, similar to clicking the Edit Icon after the Device list described earlier. Next in the Detail frame, general information of the device will be displayed. The next frame is Key, which will show details of various values that must be used to connect to the Platform, including showing the connection status. In case the connection status is incorrect, press the "Resync Status" button next to the status to update it correctly.
The last part is Device settings or viewing data generated by the Device. There are 4 tabs in total: Shadow Schema Trigger and Feed. The lower frame will display data of each tab (for details on how to set up, see Device Configuration ). In the Shadow and Schema sections, you can choose to display in 2 formats: Tree (Default) and Code (as JSON). If you want to copy and paste the Configuration, it is recommended to select the Code display. If there are edits, the "SAVE" button in the upper right corner will be active, allowing you to save the edits. If you do not want to save the edits, click the "Cancel" button. The red button on the left (Clear xxx data depending on which tab is open) will be used to view all the Configurations in that tab that have been specified.
Group
Used to define the communication scope between each device. Devices that can communicate with each other must be placed under the same Group. To manage Group information, click on "Group" in the left menu bar. A screen will appear showing all Groups that have been created within that Project (if any), as shown in the figure.
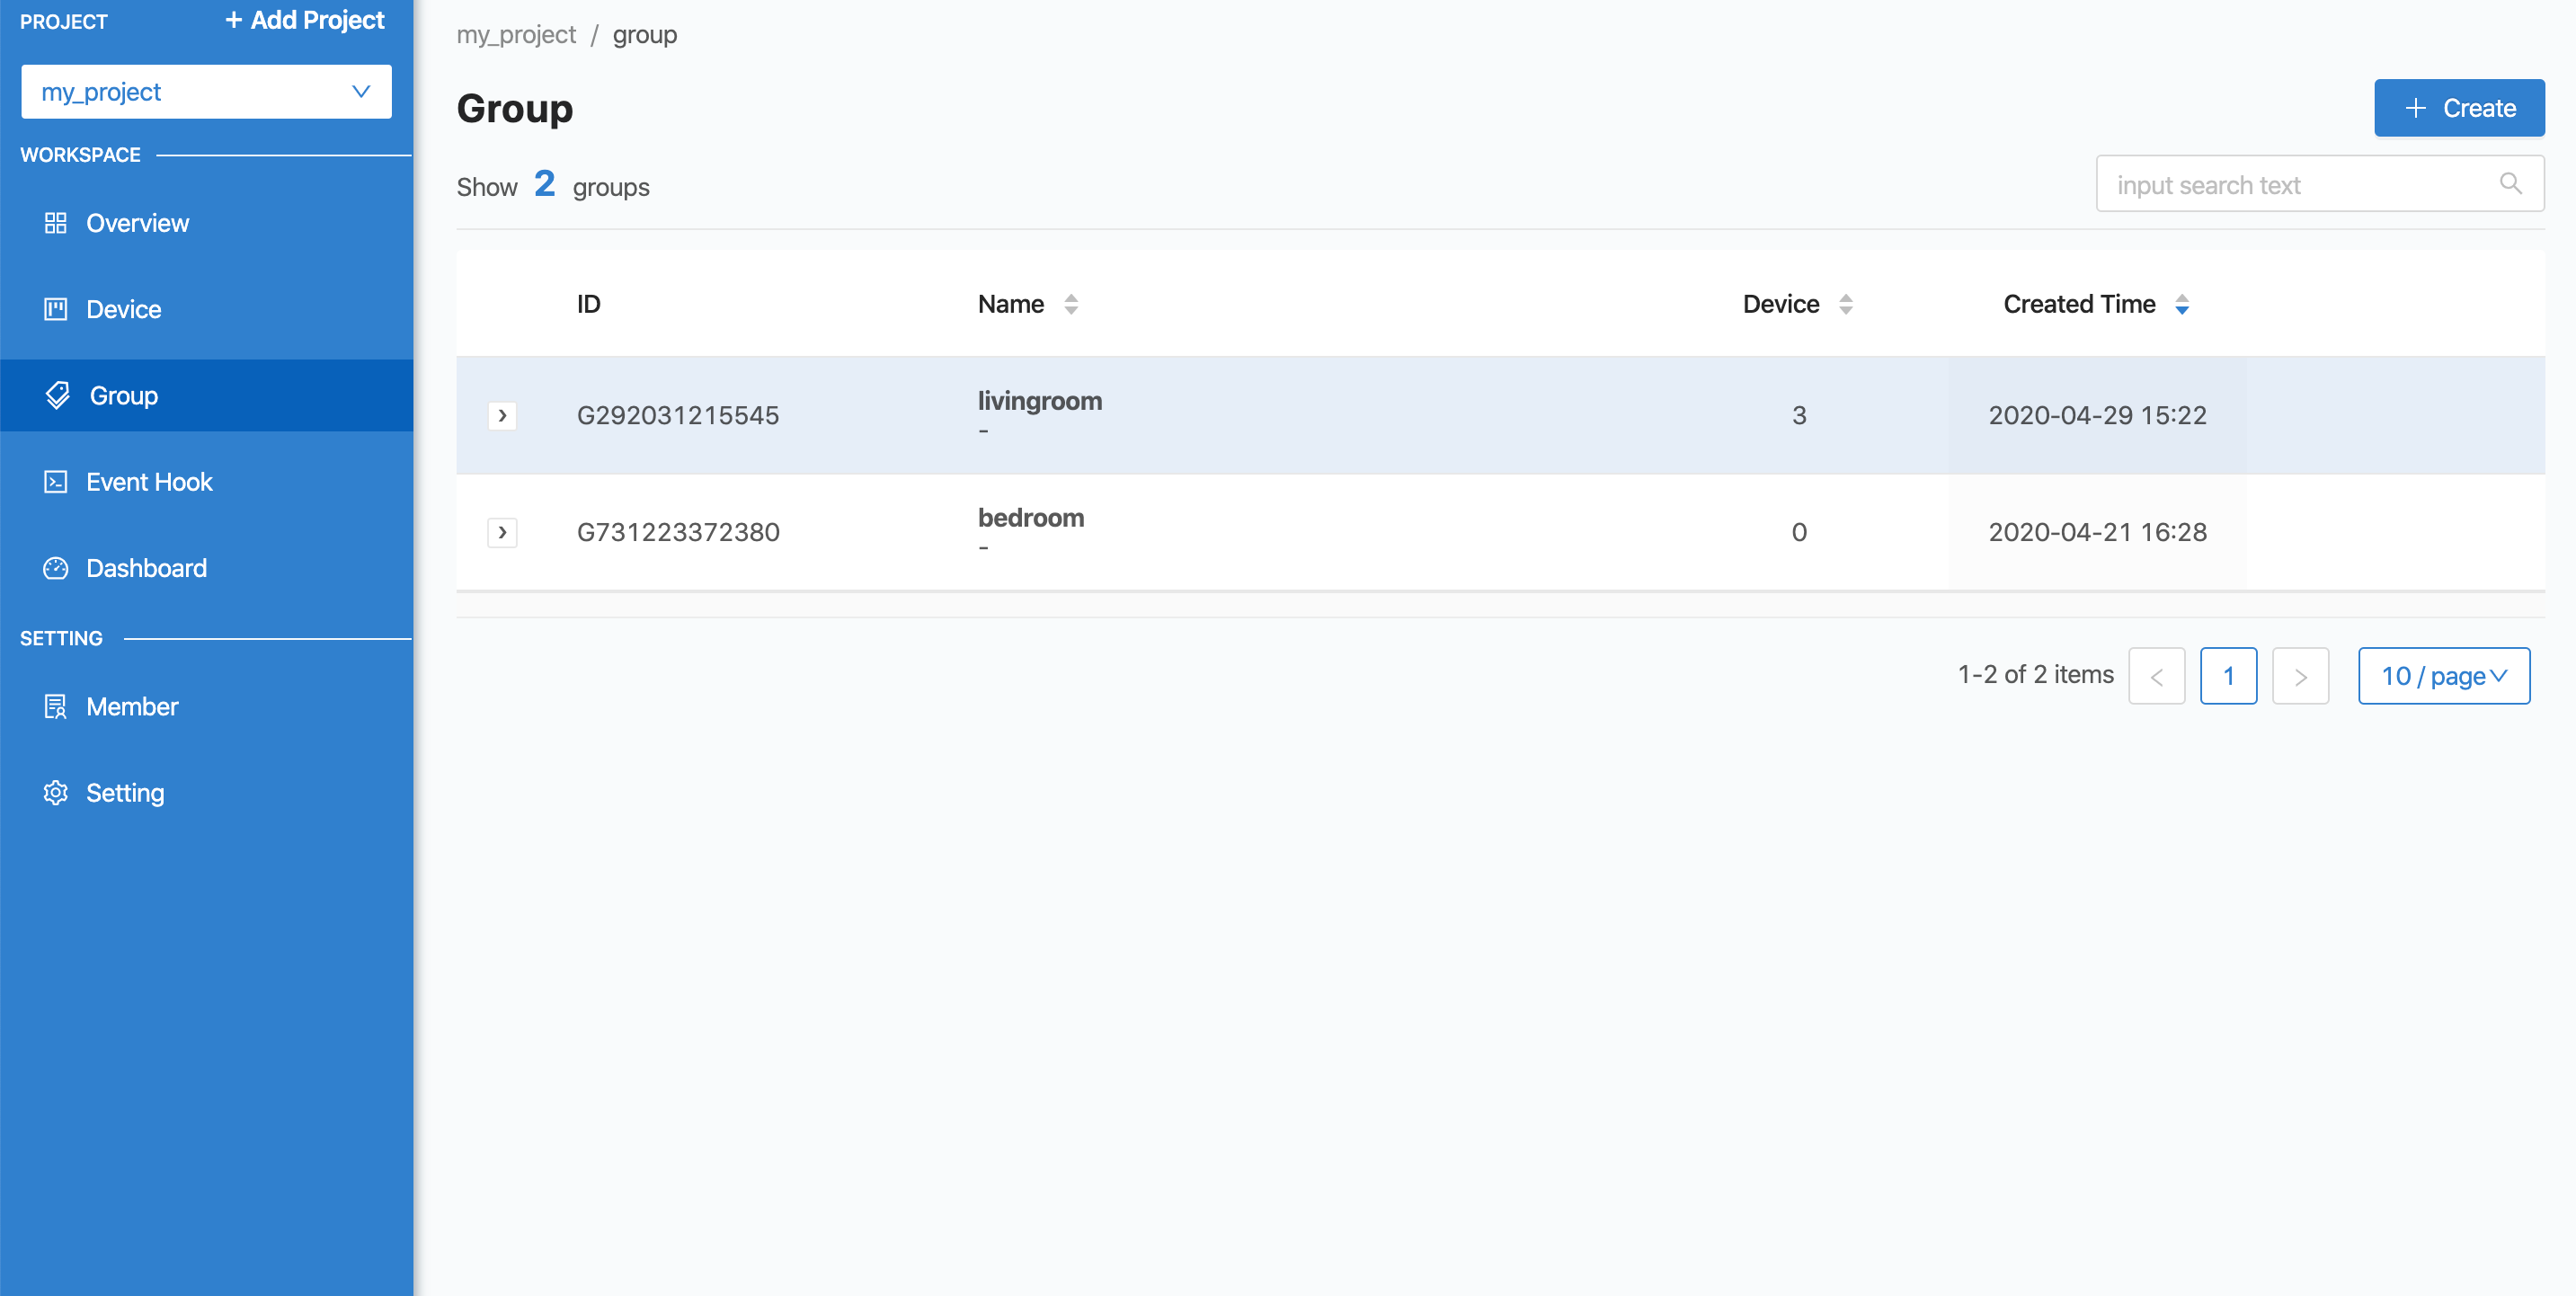
From the image above, to create a new Group, click on the "Create" button in the upper right corner. When clicked, a form will appear for filling in information as shown in the image.
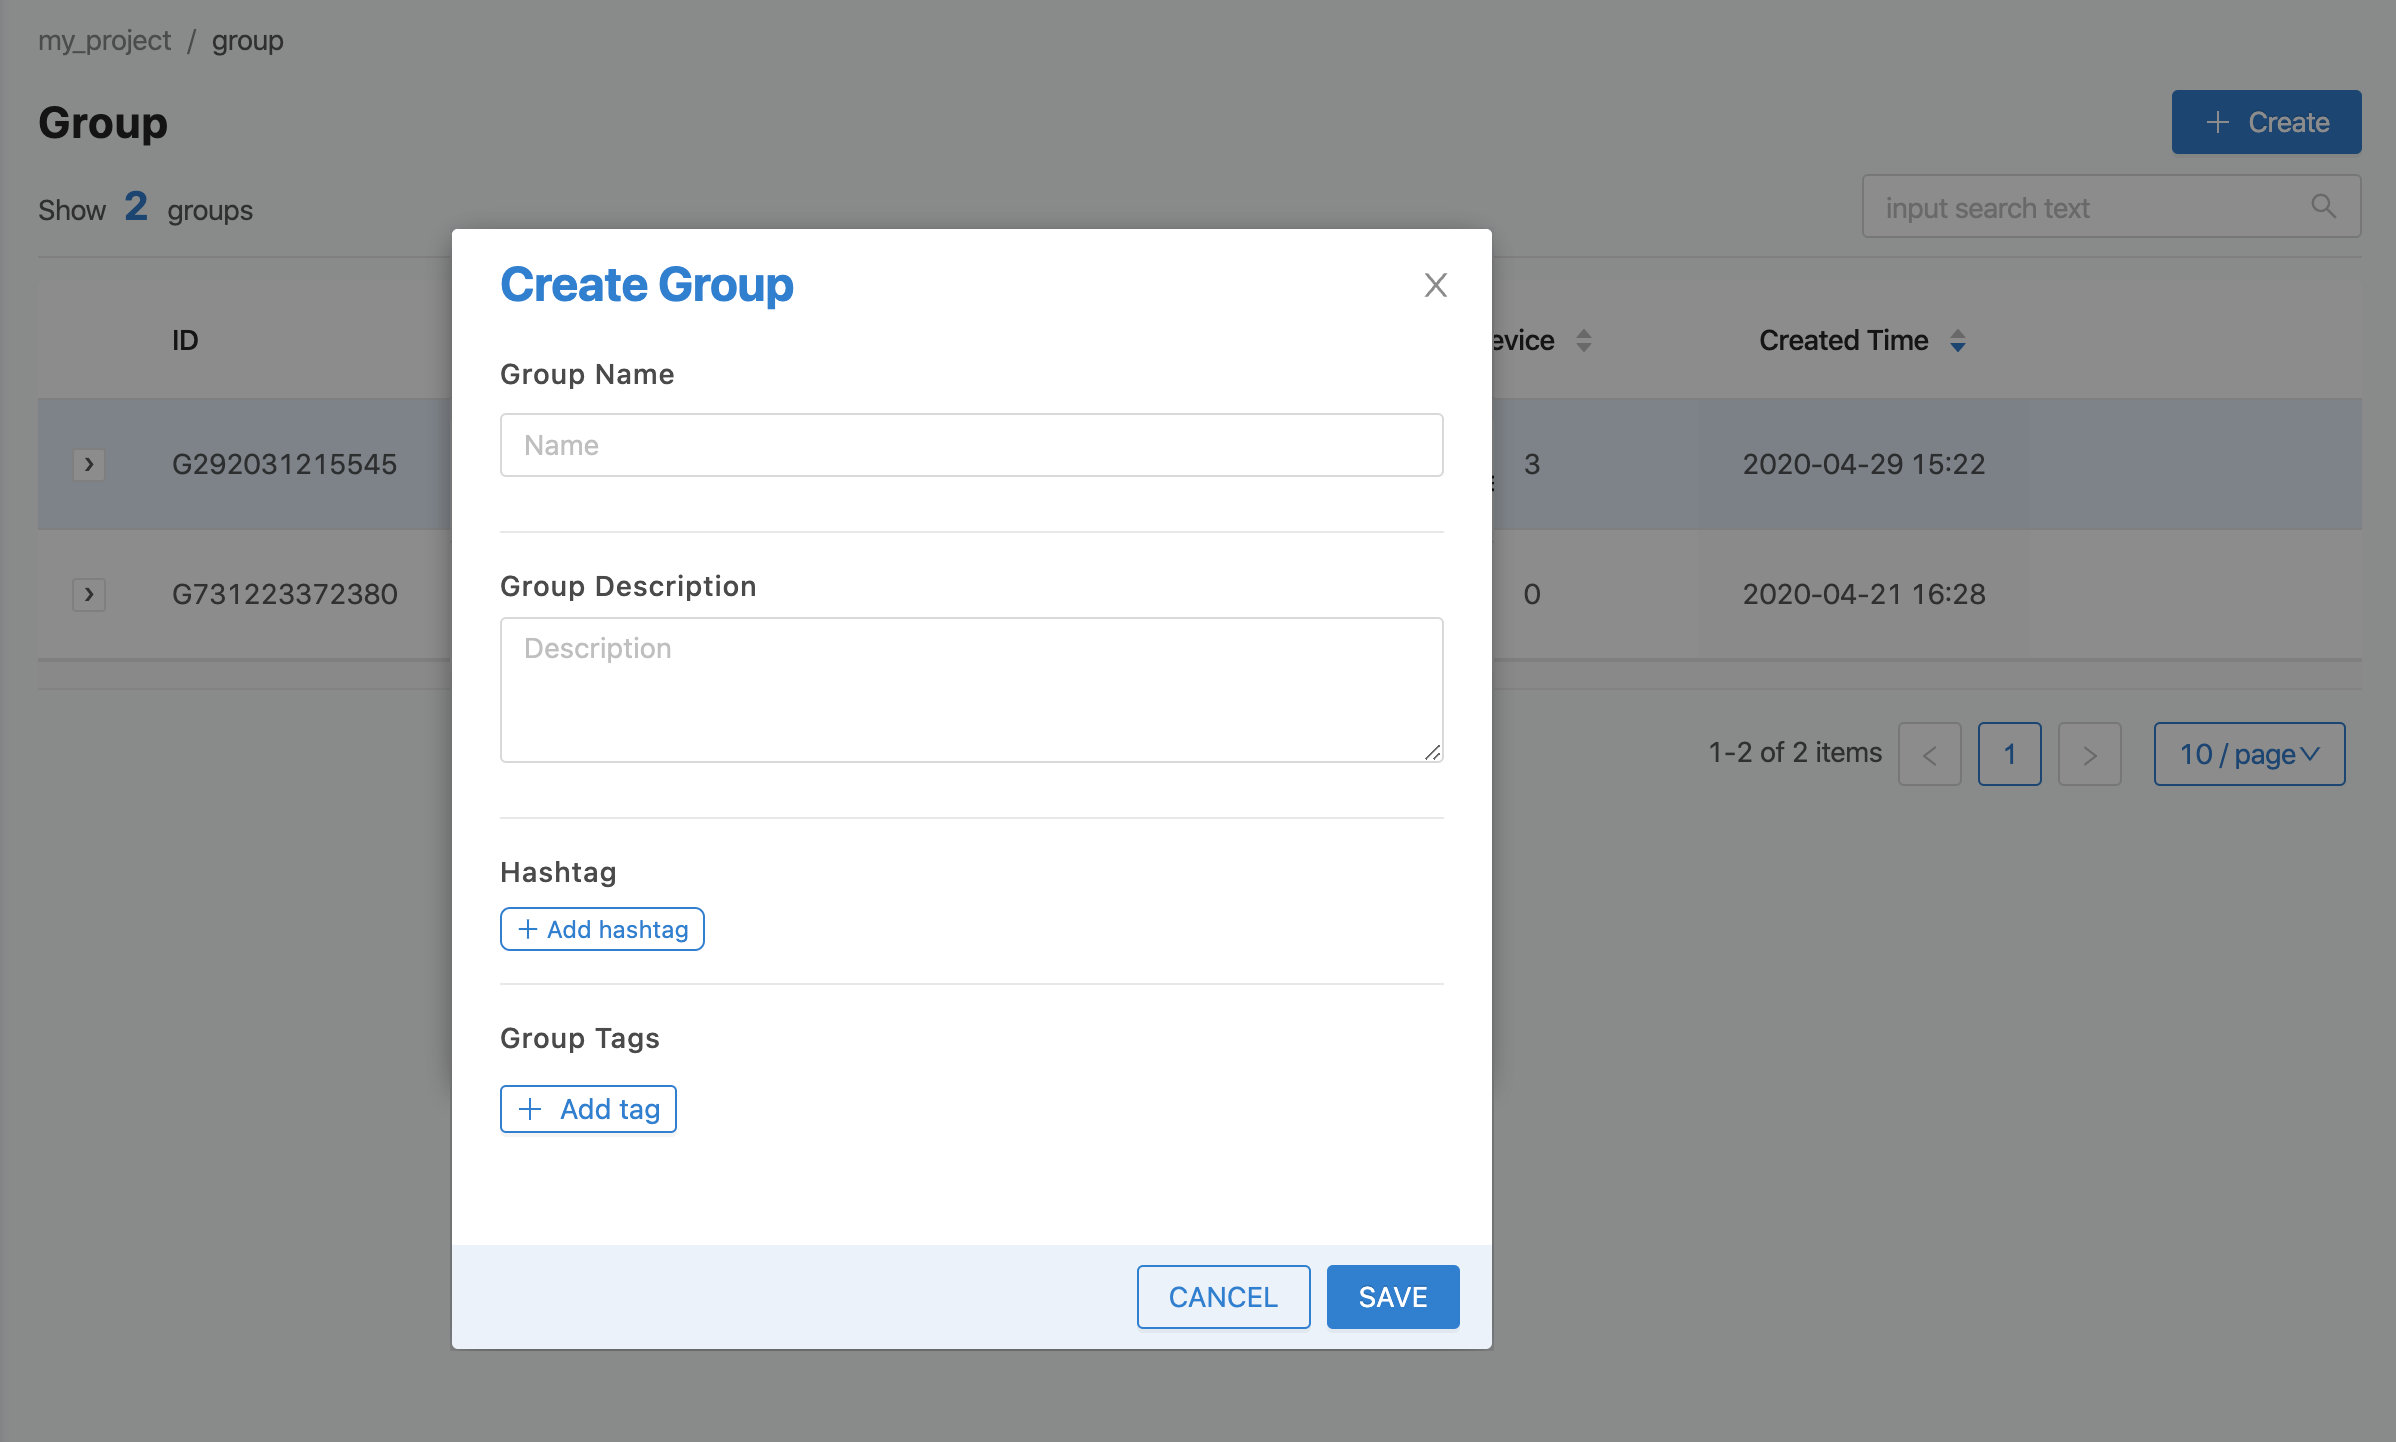
From the image above, the Group information that can be identified is as follows:
Group Name |
Group names do not allow white spaces in the name. |
Group Description |
Group Description |
Hashtag |
Keywords are used to filter data. |
Group Tags |
Key-Value is used to filter data. |
When you have filled in all the information, click on the "SAVE" button, and the newly created Group will appear on top as the top list, as shown in the figure.
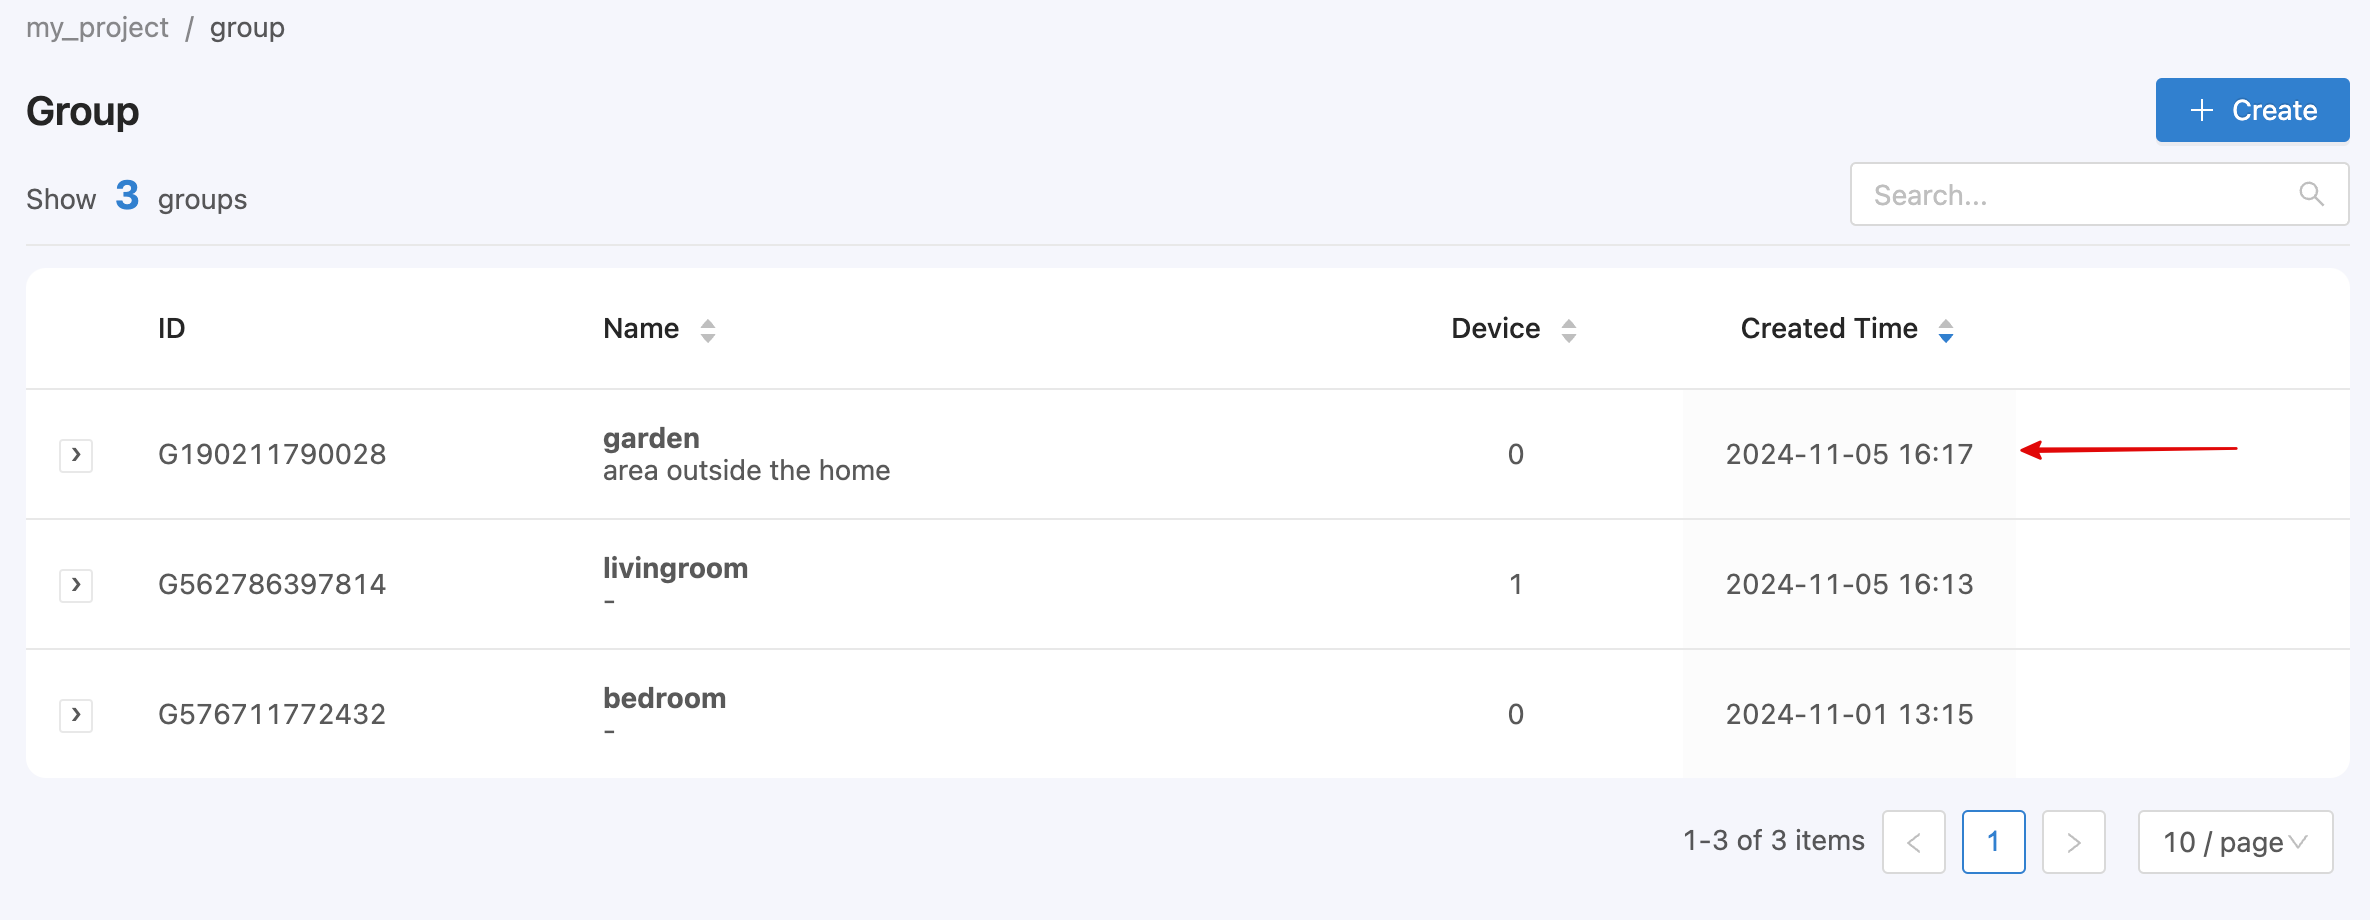
To edit or delete a Group, place the cursor over the Group you want to edit. An icon will appear for you to click to edit or delete that Group (the Group to be deleted must not have any Devices under it). When you click on each Group item, it will take you to a screen that shows a list of Devices under that Group, as shown in the figure.
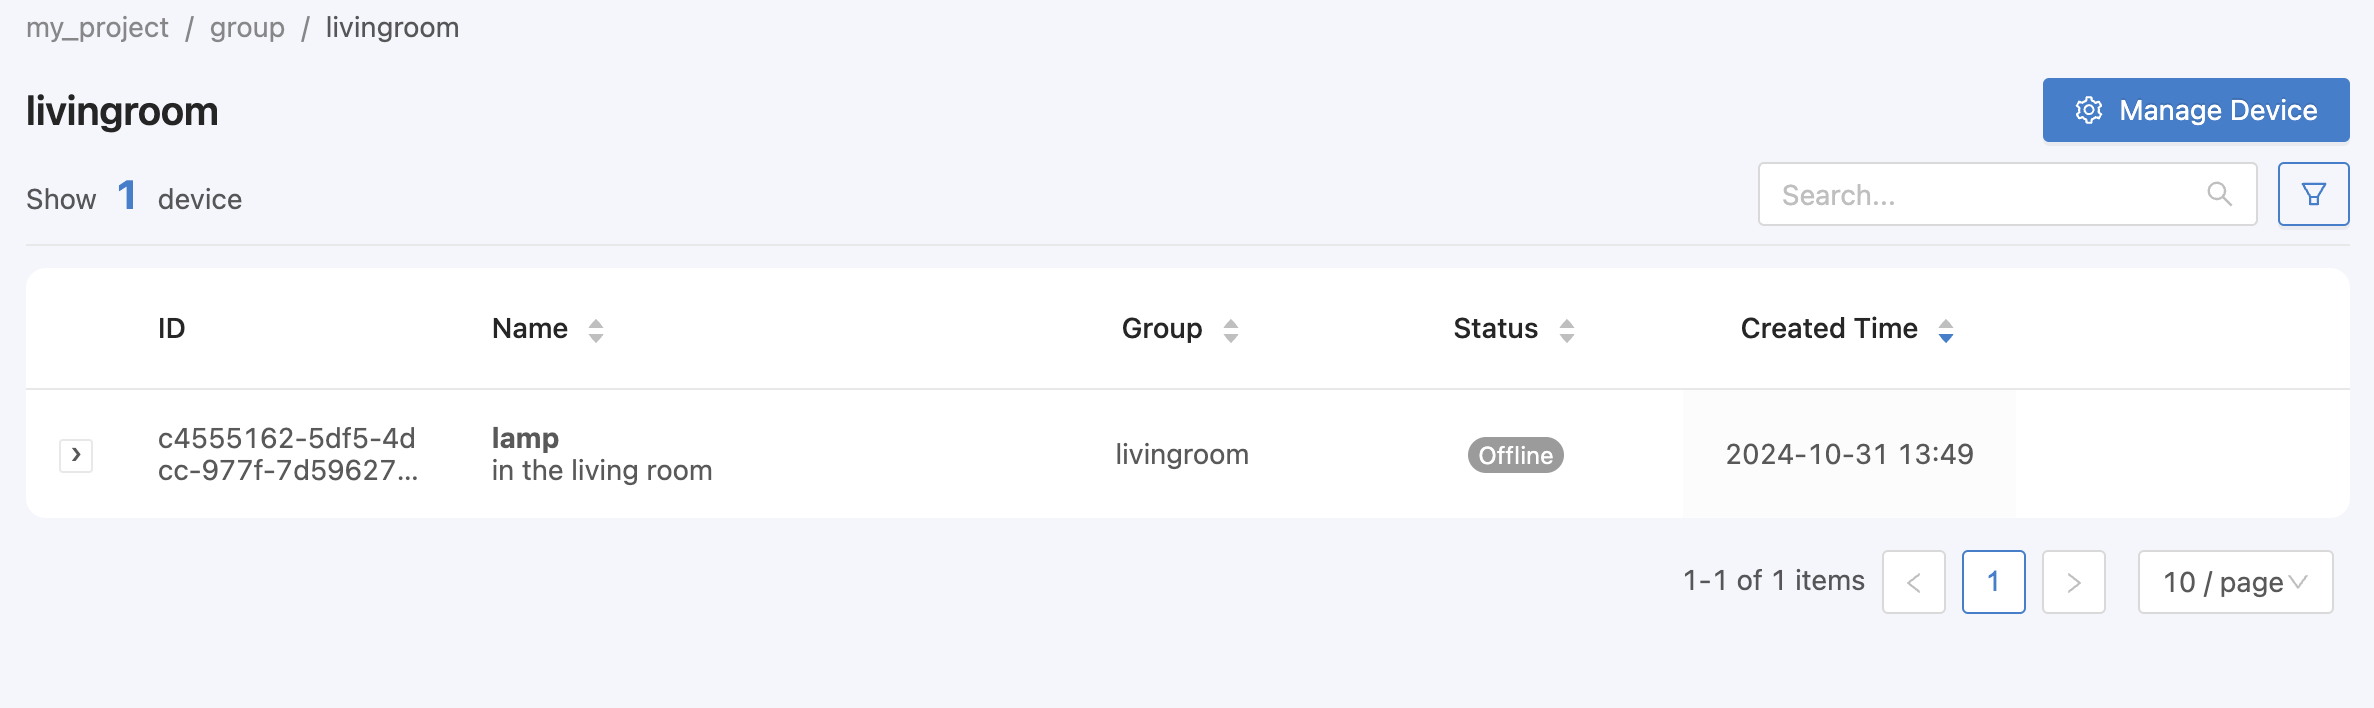
From the picture above, there is 1 Device under this Group. You can change the Device in the Group by clicking on the "Manage Device" button. The screen will appear as shown in the picture.
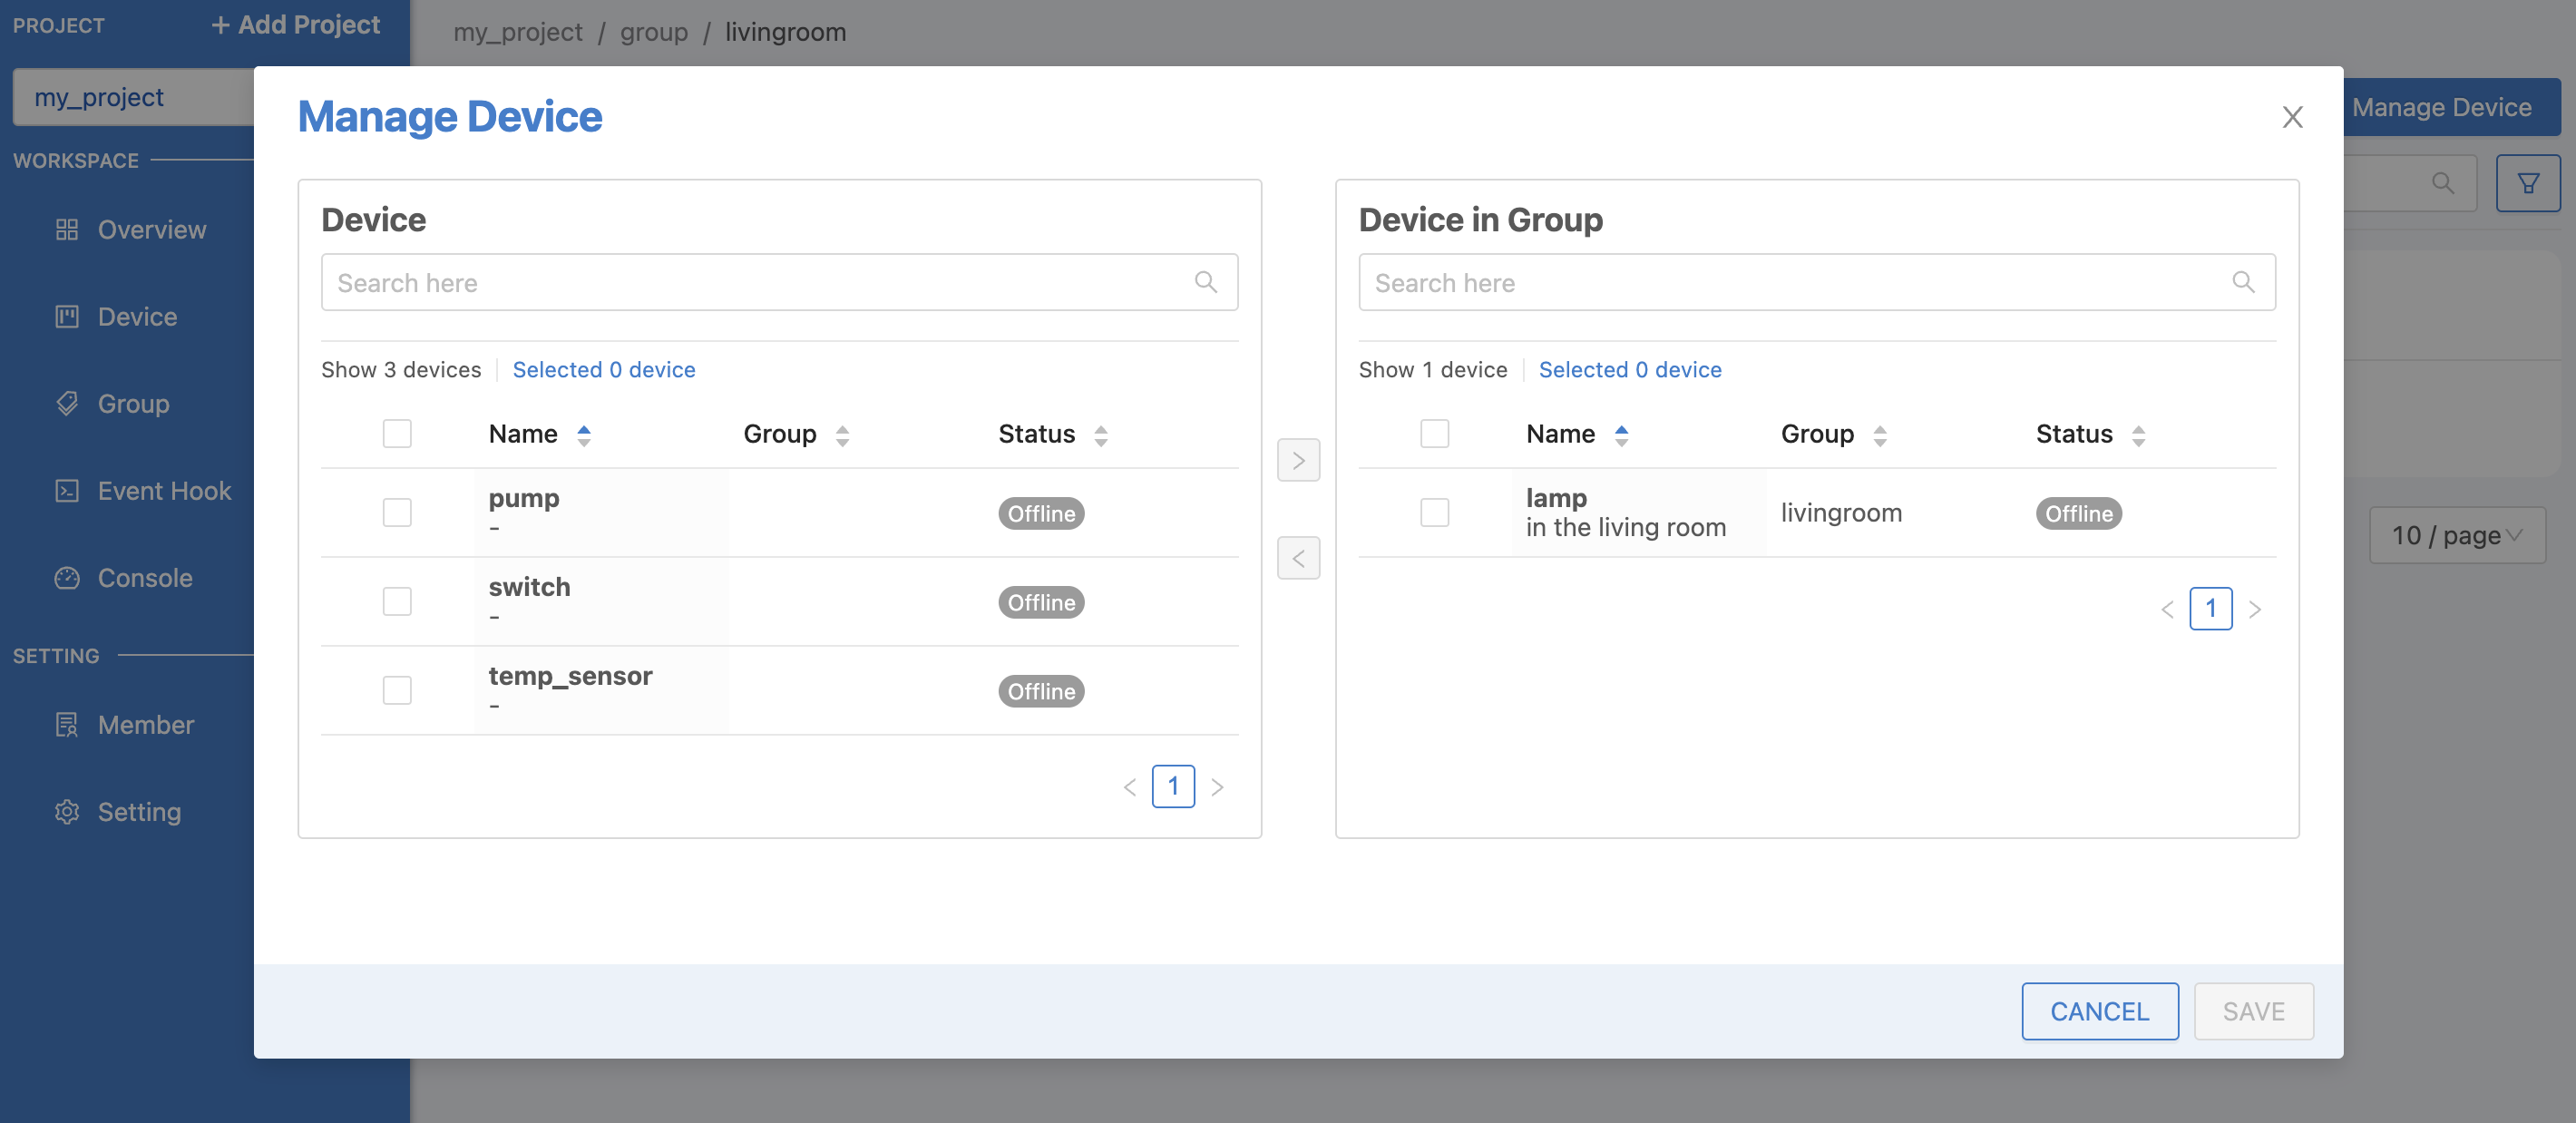
From the image above, there will be a list of devices displayed separately on 2 sides. On the left side is a list of devices that are not under the said group. If you want to arrange those devices into a group, click on the checkbox in front of the desired device list, then click on the ">" button to move them into the group. On the opposite side, on the right side is a list of devices that are already under the said group. If you want to remove them from the group, click on the checkbox in front of the desired device list, then click on the "<" button to move the device out of the group. Then, click the "SAVE" button below to save the information.
Event Hook
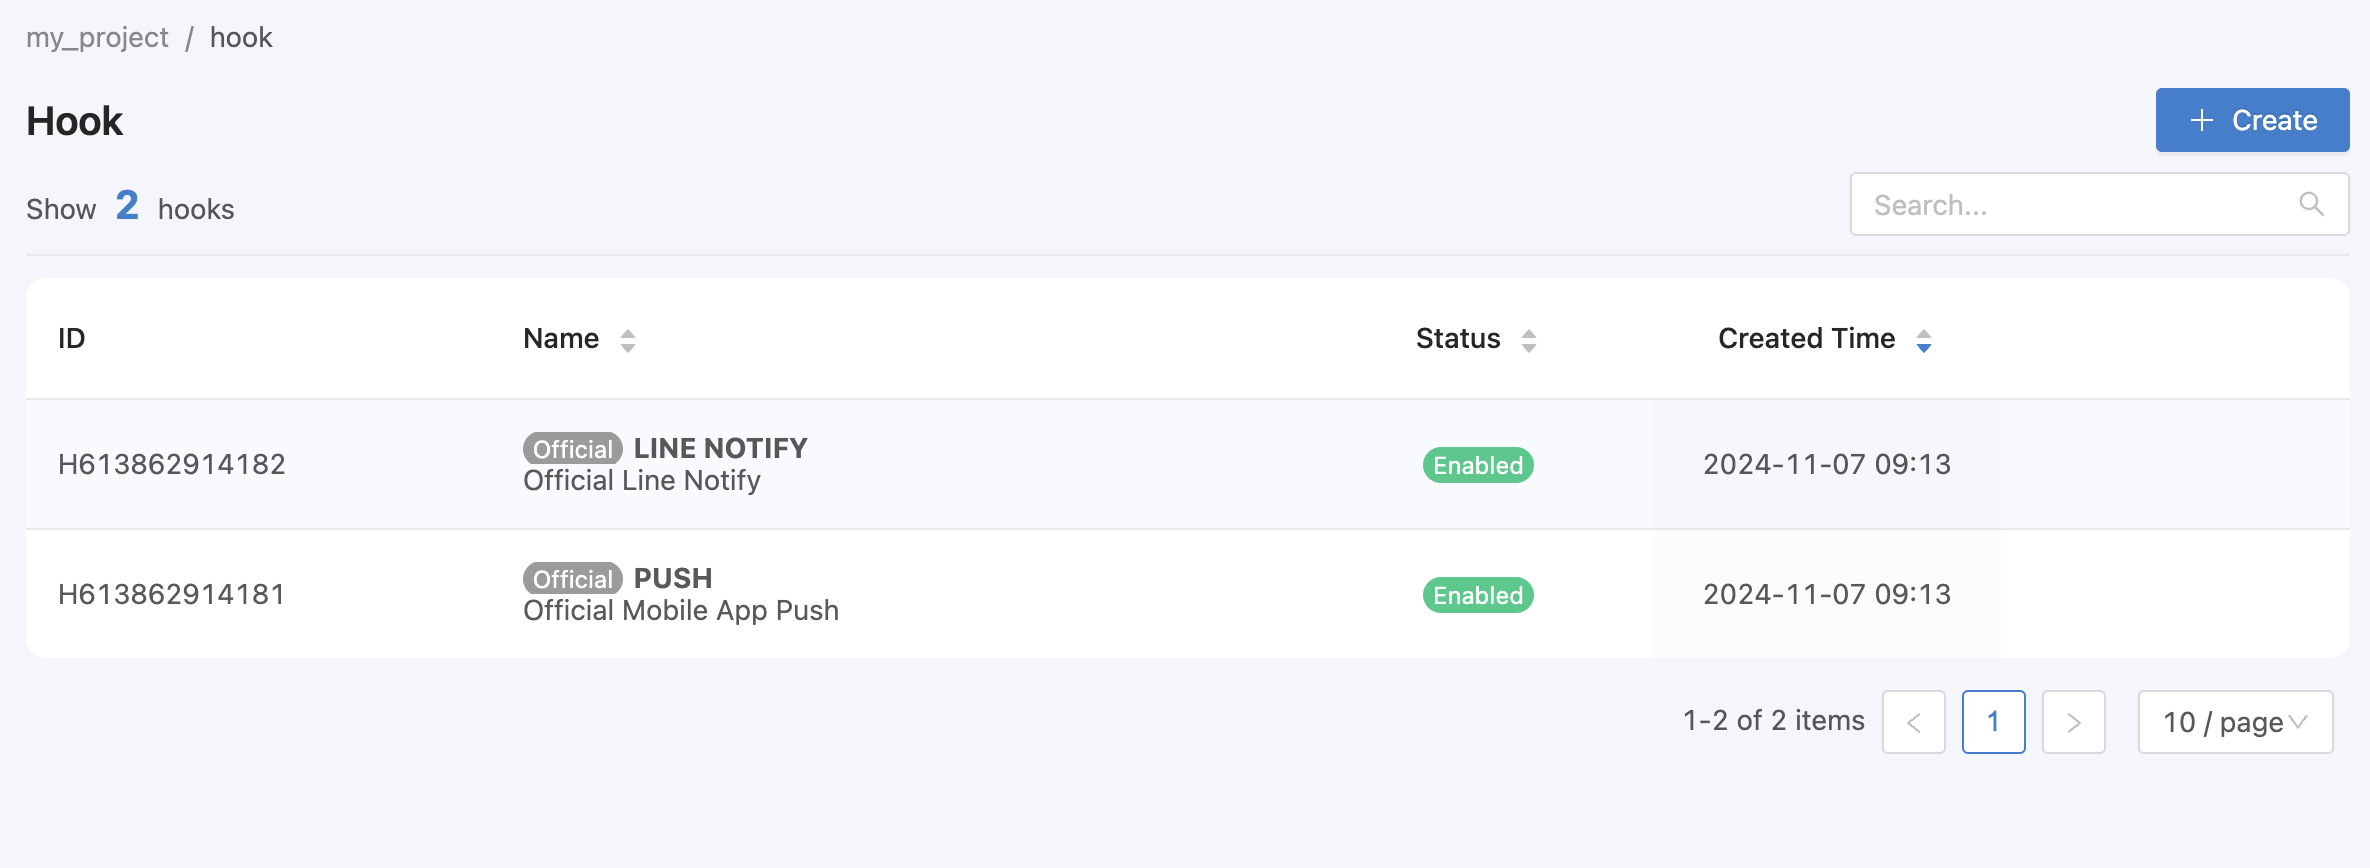
It is a middleman used to determine what action to take when a Trigger (as defined in the Trigger tab on each Device) occurs. The Event Hook will be referenced in each Trigger that has been created. To manage Event Hook information, click on "Event Hook" in the left-hand menu bar. A screen will appear showing a list of all Event Hooks ever created within that Project. By default, the system will have 2 Official Event Hooks available for use. Users will not be able to delete or edit the Official Event Hooks (for more details on Official Event Hooks, see Device Configuration), as shown in the figure.
From the above figure, to create a new Event Hook, click on the "Create" button on the top right corner. When clicked, a form will appear for filling in data as shown in the figure.
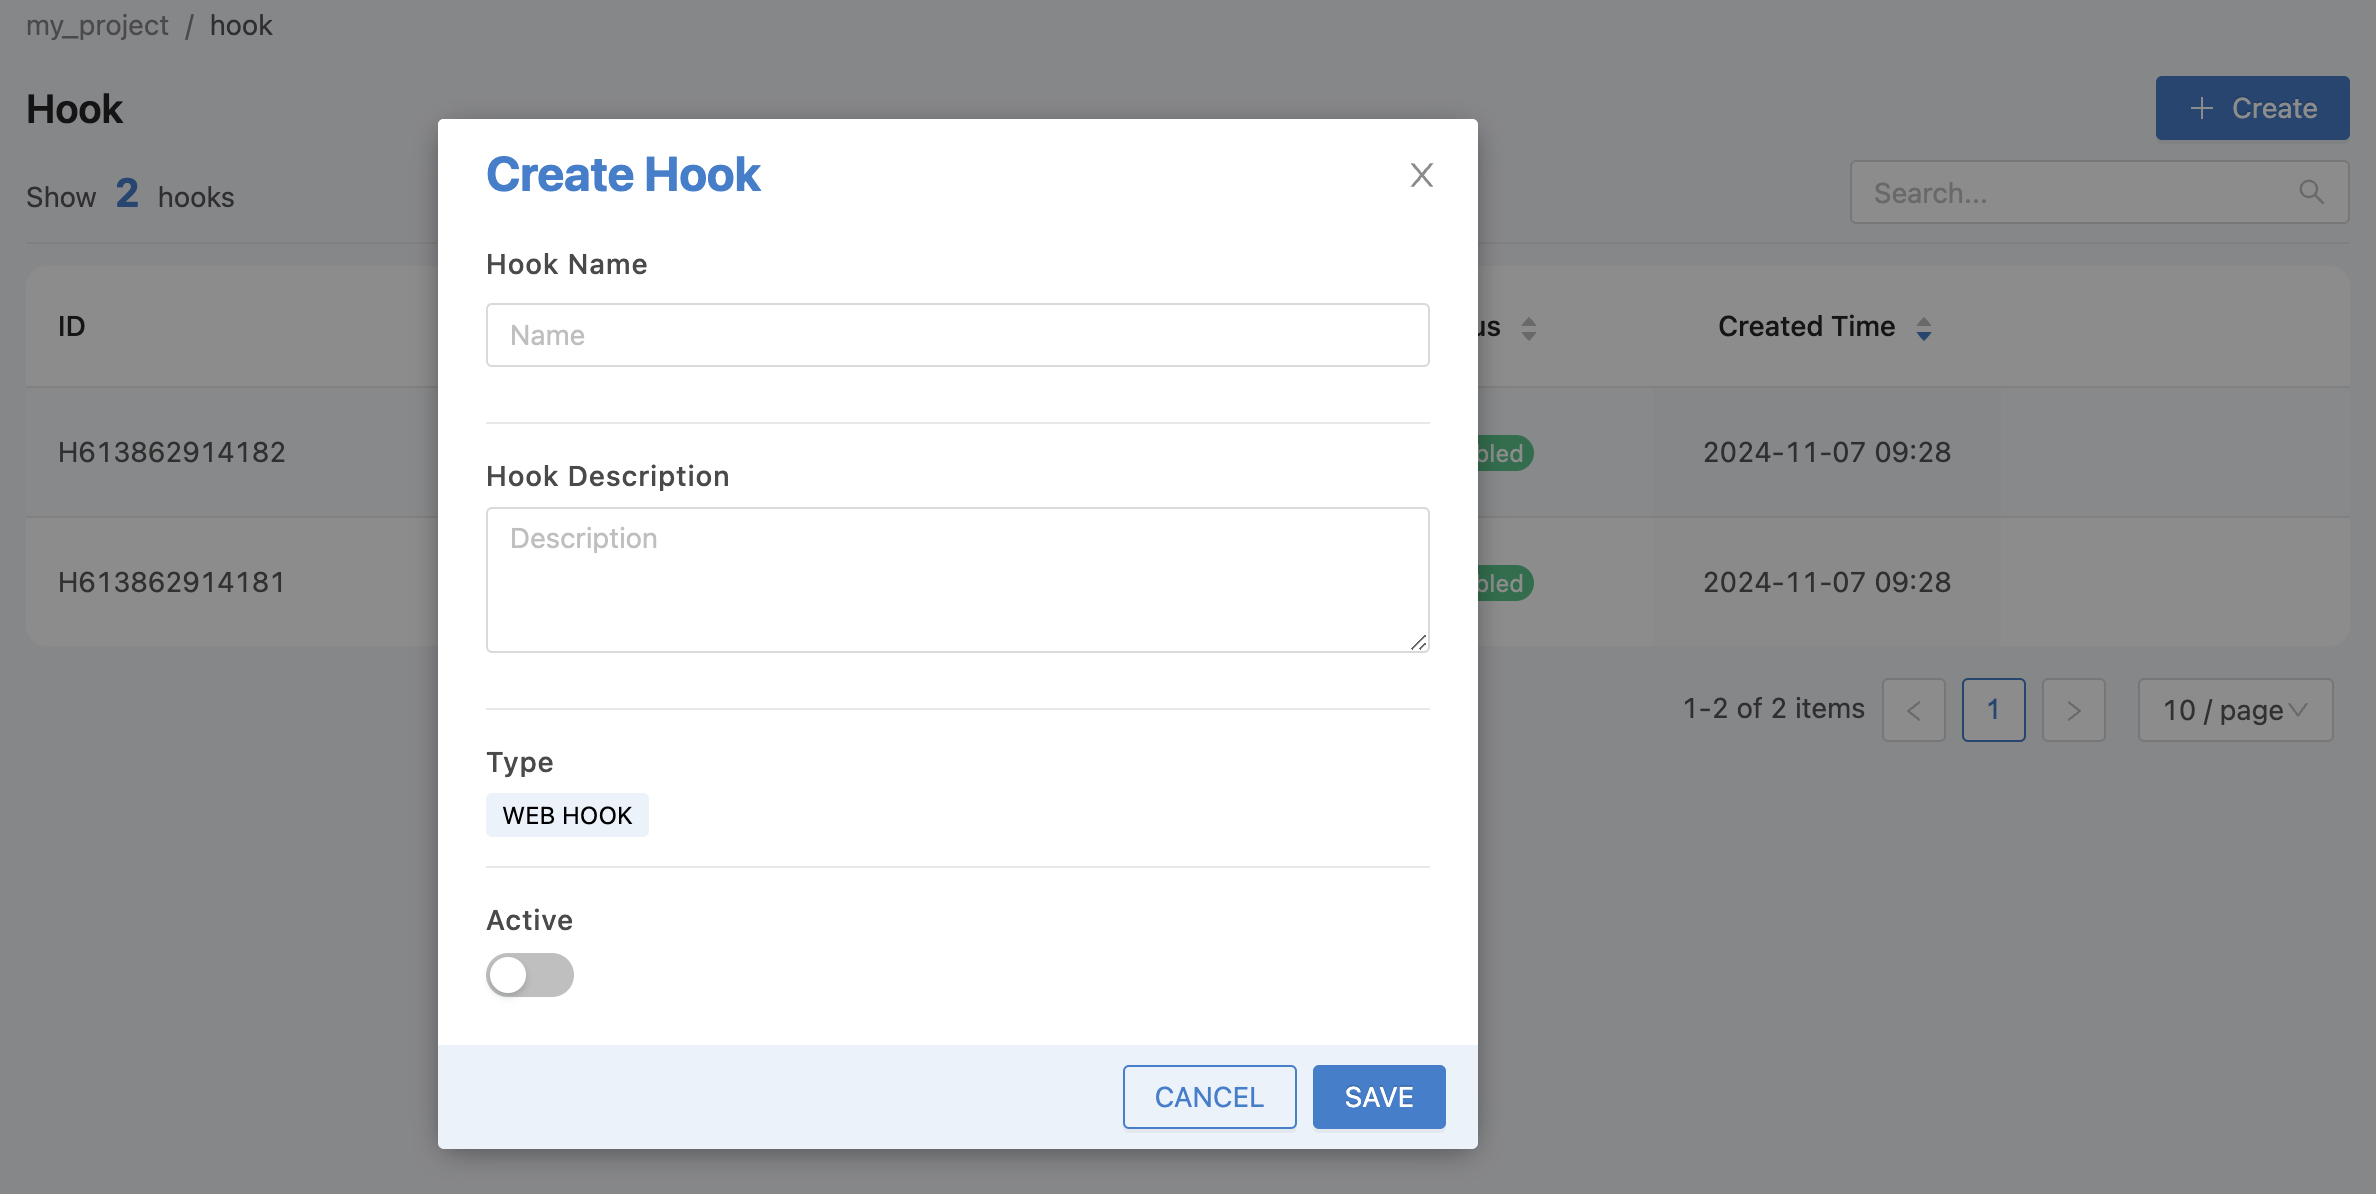
From the figure above, the Event Hook information that can be specified is as follows:
Hook Name |
Event Hook names do not allow white spaces in the name. |
Hook Description |
Event Hook Description |
Type |
Event Hook Type (Currently there is only one type, so you don't have to choose yet) |
Active |
Event Hook Enable/Disable Status |
Once you have filled in all the information, click on the "SAVE" button, and the newly created Event Hook list will appear, as shown in the figure.
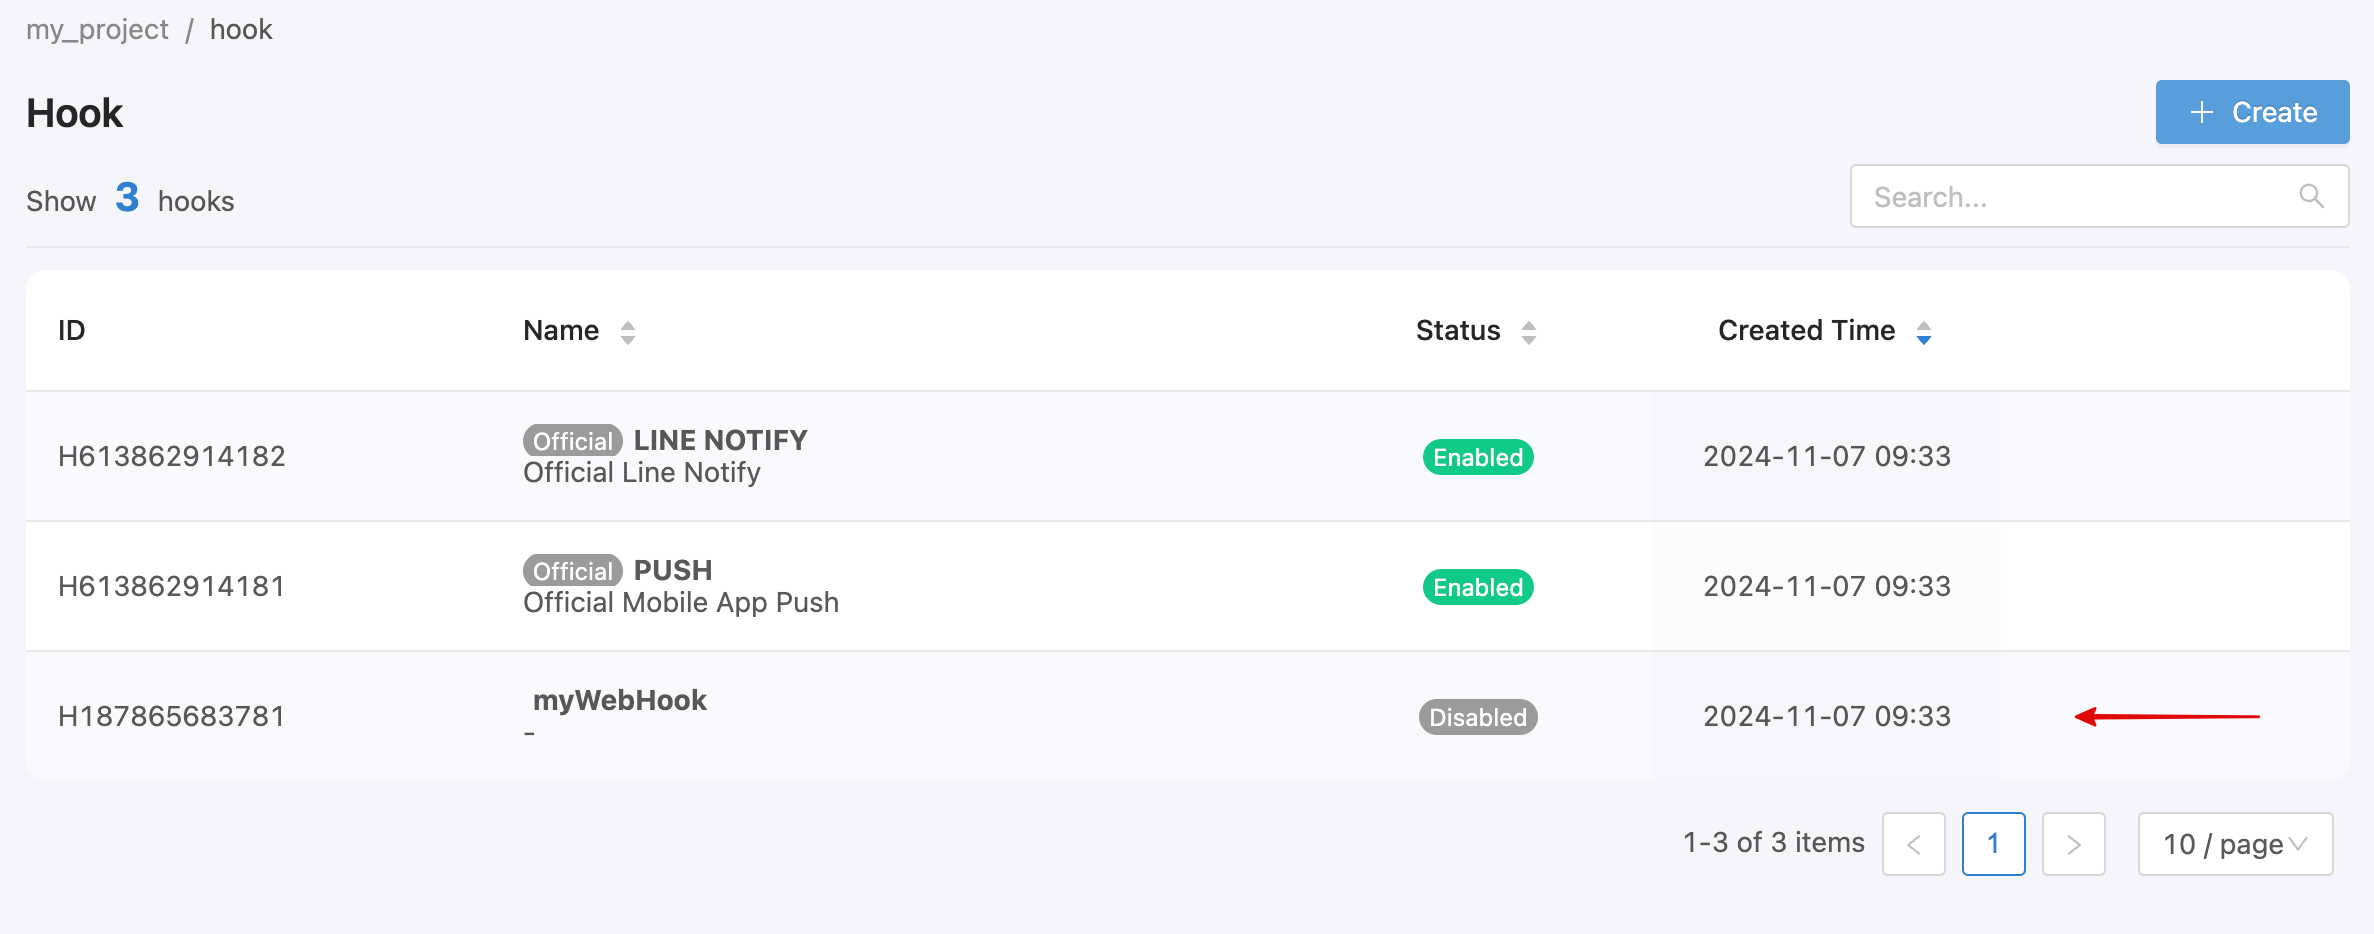
To edit or delete an Event Hook (except Official), hover the cursor over the Event Hook you want to process. An icon will appear for you to click to edit or delete that Event Hook. When you click on each Event Hook, it will take you to a screen that lists that Event Hook, as shown in the figure.
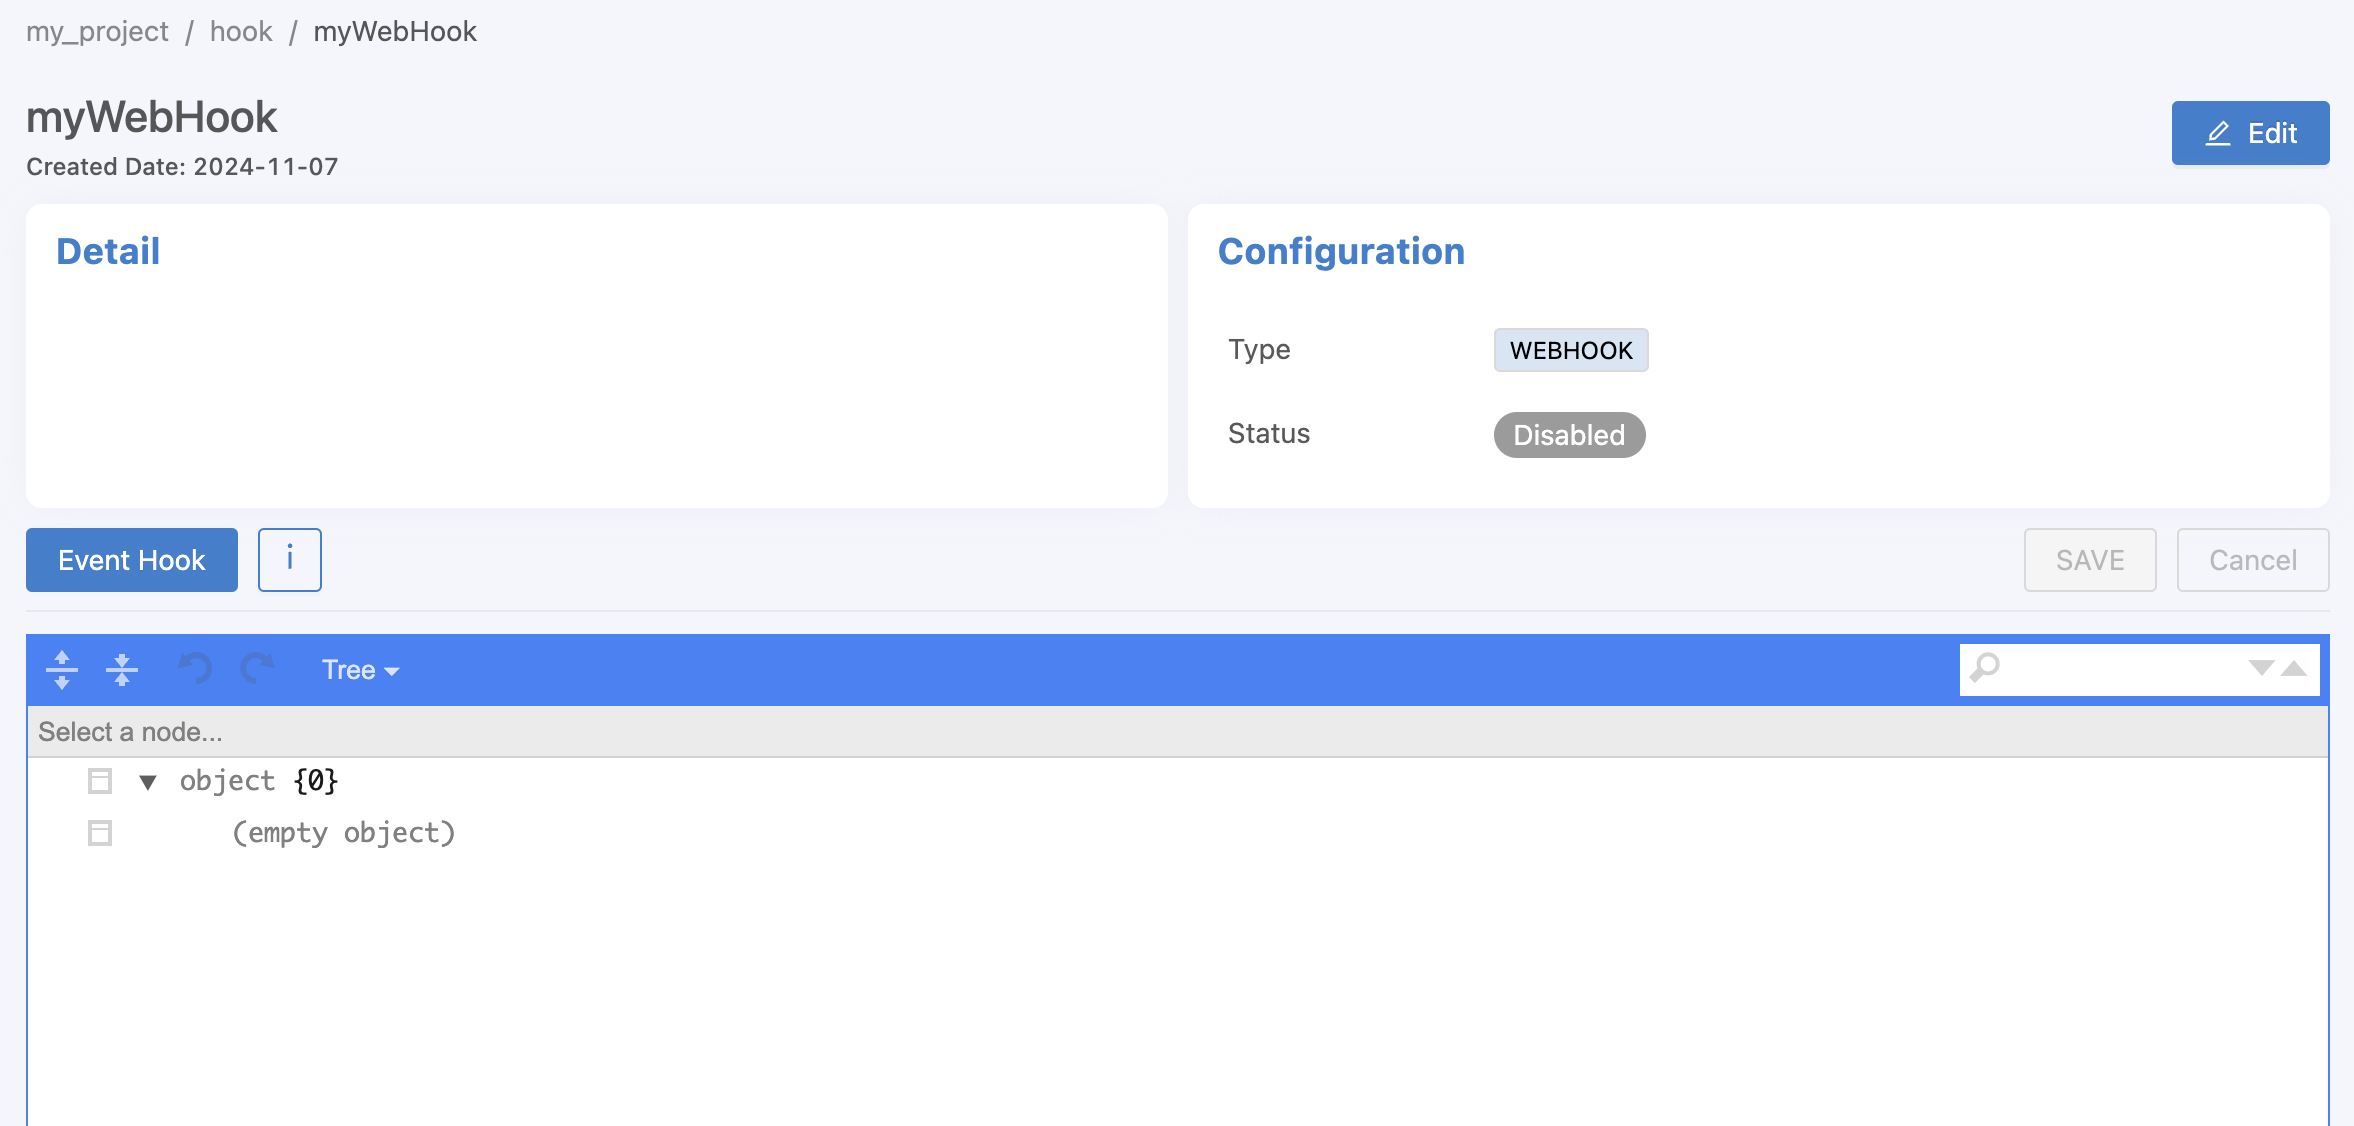
From the image above, when clicking on the Event Hook item, various information and a section for setting up the Event Hook will appear. The top left corner will display the Event Hook name and the date the Event Hook was created. In the top right corner, there will be an "Edit" button. When clicked, a form will appear for editing Event Hook information (except Official). Next in the Detail frame, there will be information showing the description of the Event Hook. The next frame is Configuration, which will display the type and status of enabling the Event Hook (Disable, Enable).
For setting up the Event Hook, it will be at the bottom. The configuration in this section will be in JSON format, similar to setting up the Device (for details on how to set up, see Device Configuration). You can choose to display in 2 formats: Tree (Default) and Code. If you want to copy and paste the values, it is recommended to choose to display as Code. If there are any changes, the "SAVE" button in the upper right corner will be Active, allowing you to press to save the changes. Or if you want to save the changes, click the "Cancel" button.
Console
Tooling for creating Data Visualization or Control Dashboard from data available in the Platform. Currently, there are 2 types to choose from:
"Panel" menu
It is suitable for Data Visualization in the form of summary data or reports. It does not support back control to the Device. To use, click on the "Panel" submenu in the left menu bar. The screen will appear as shown in the picture.
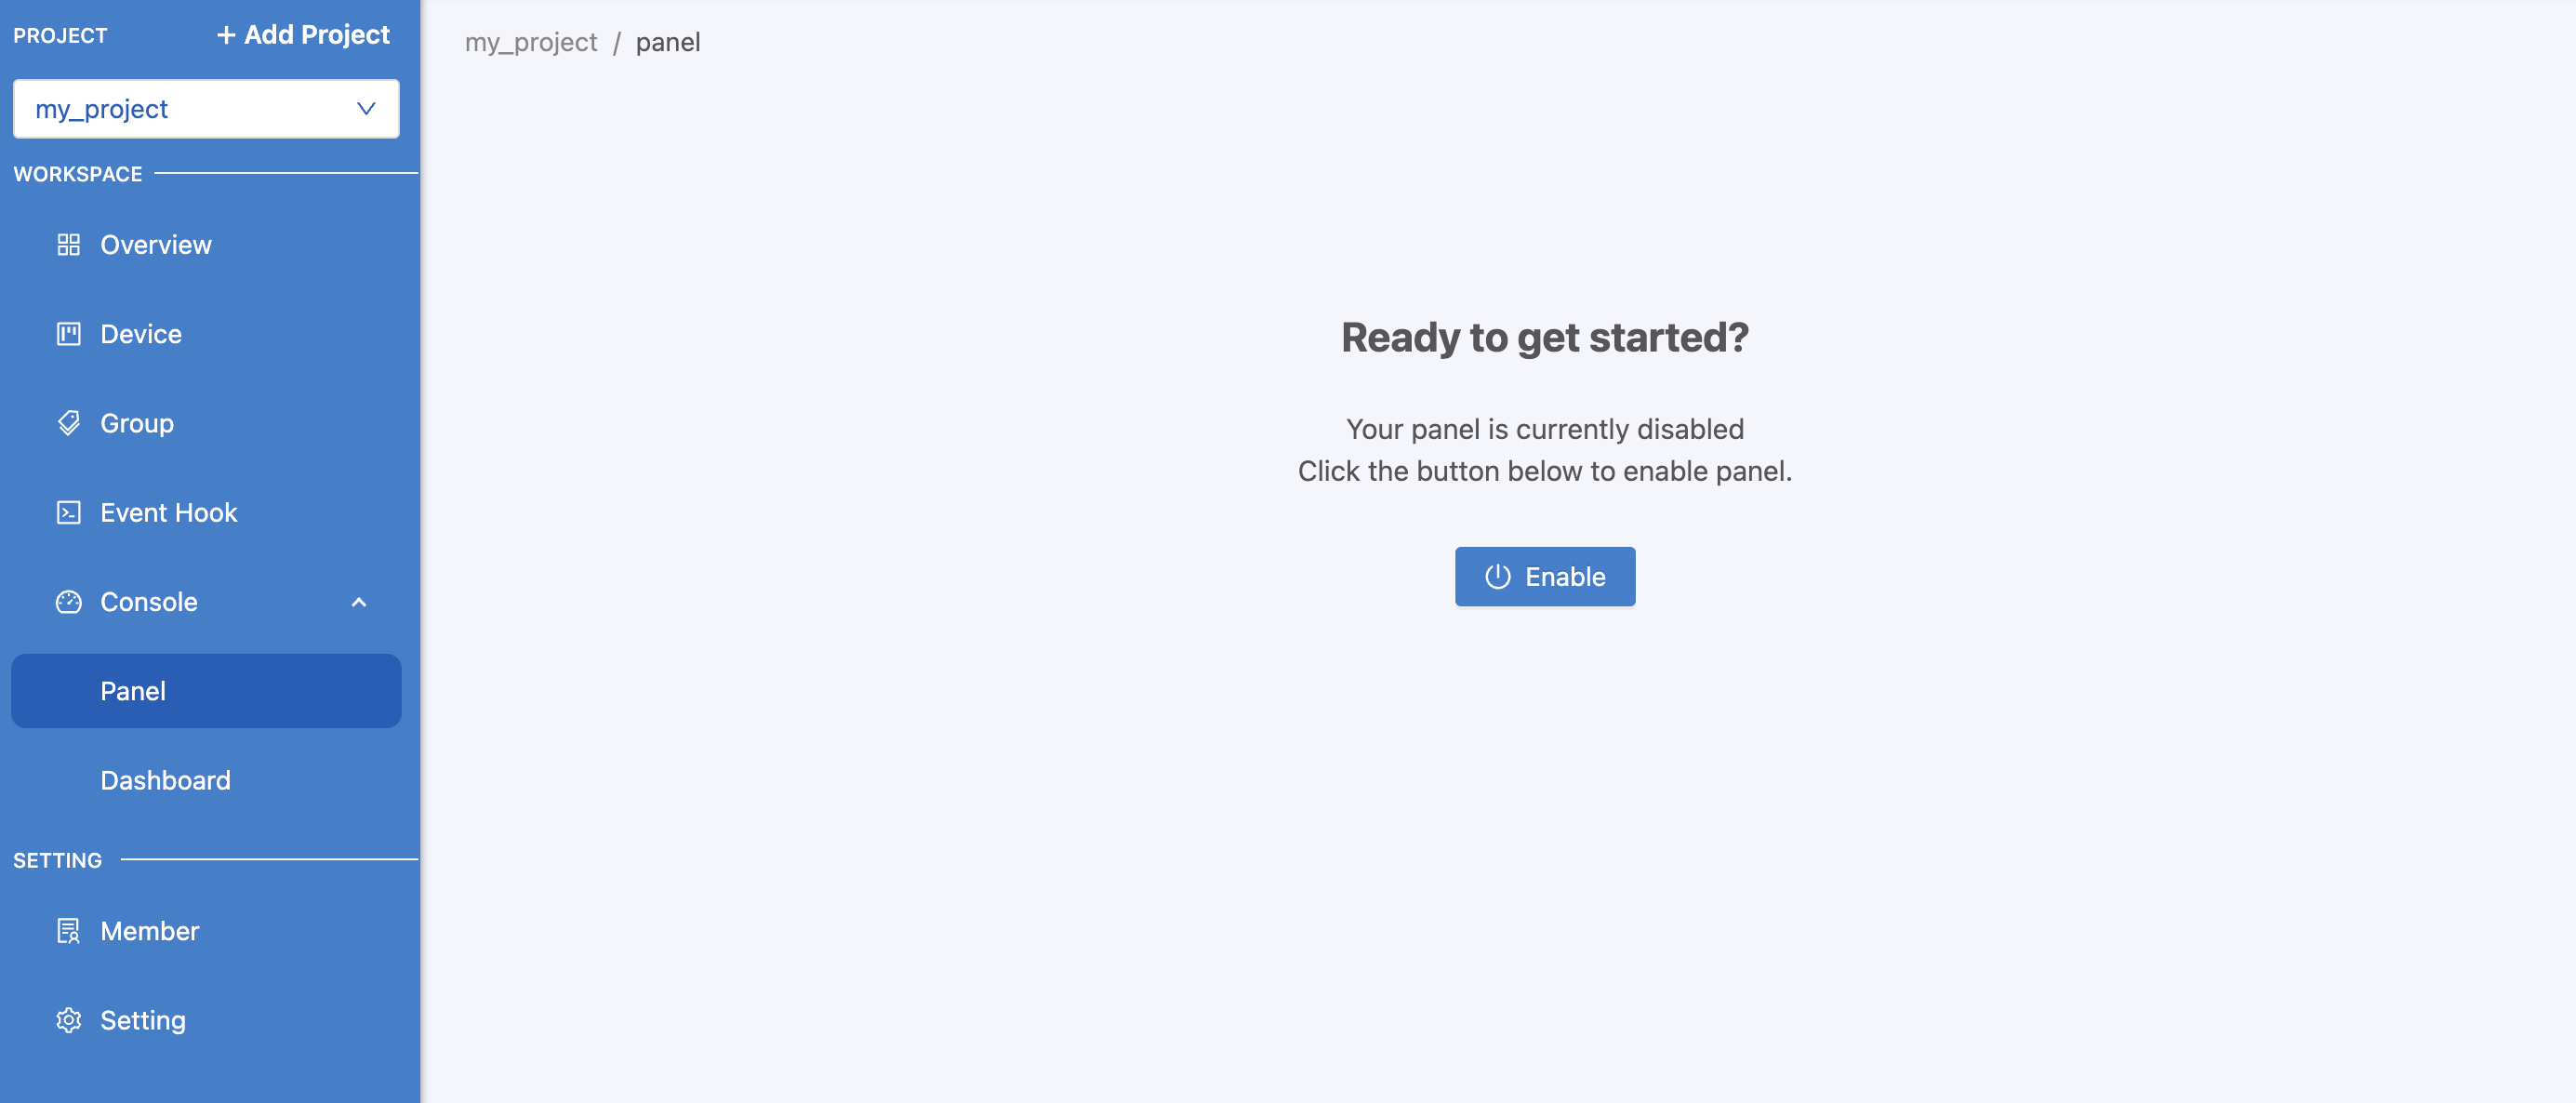
From the picture above, if it is the first time to use (under each Project), enable the initial use by clicking the "Enable" button. The system will set the default settings for use. After that, you can create a Panel by clicking the "Create" button in the upper right corner. A form will appear to set the Panel name as shown in the picture.
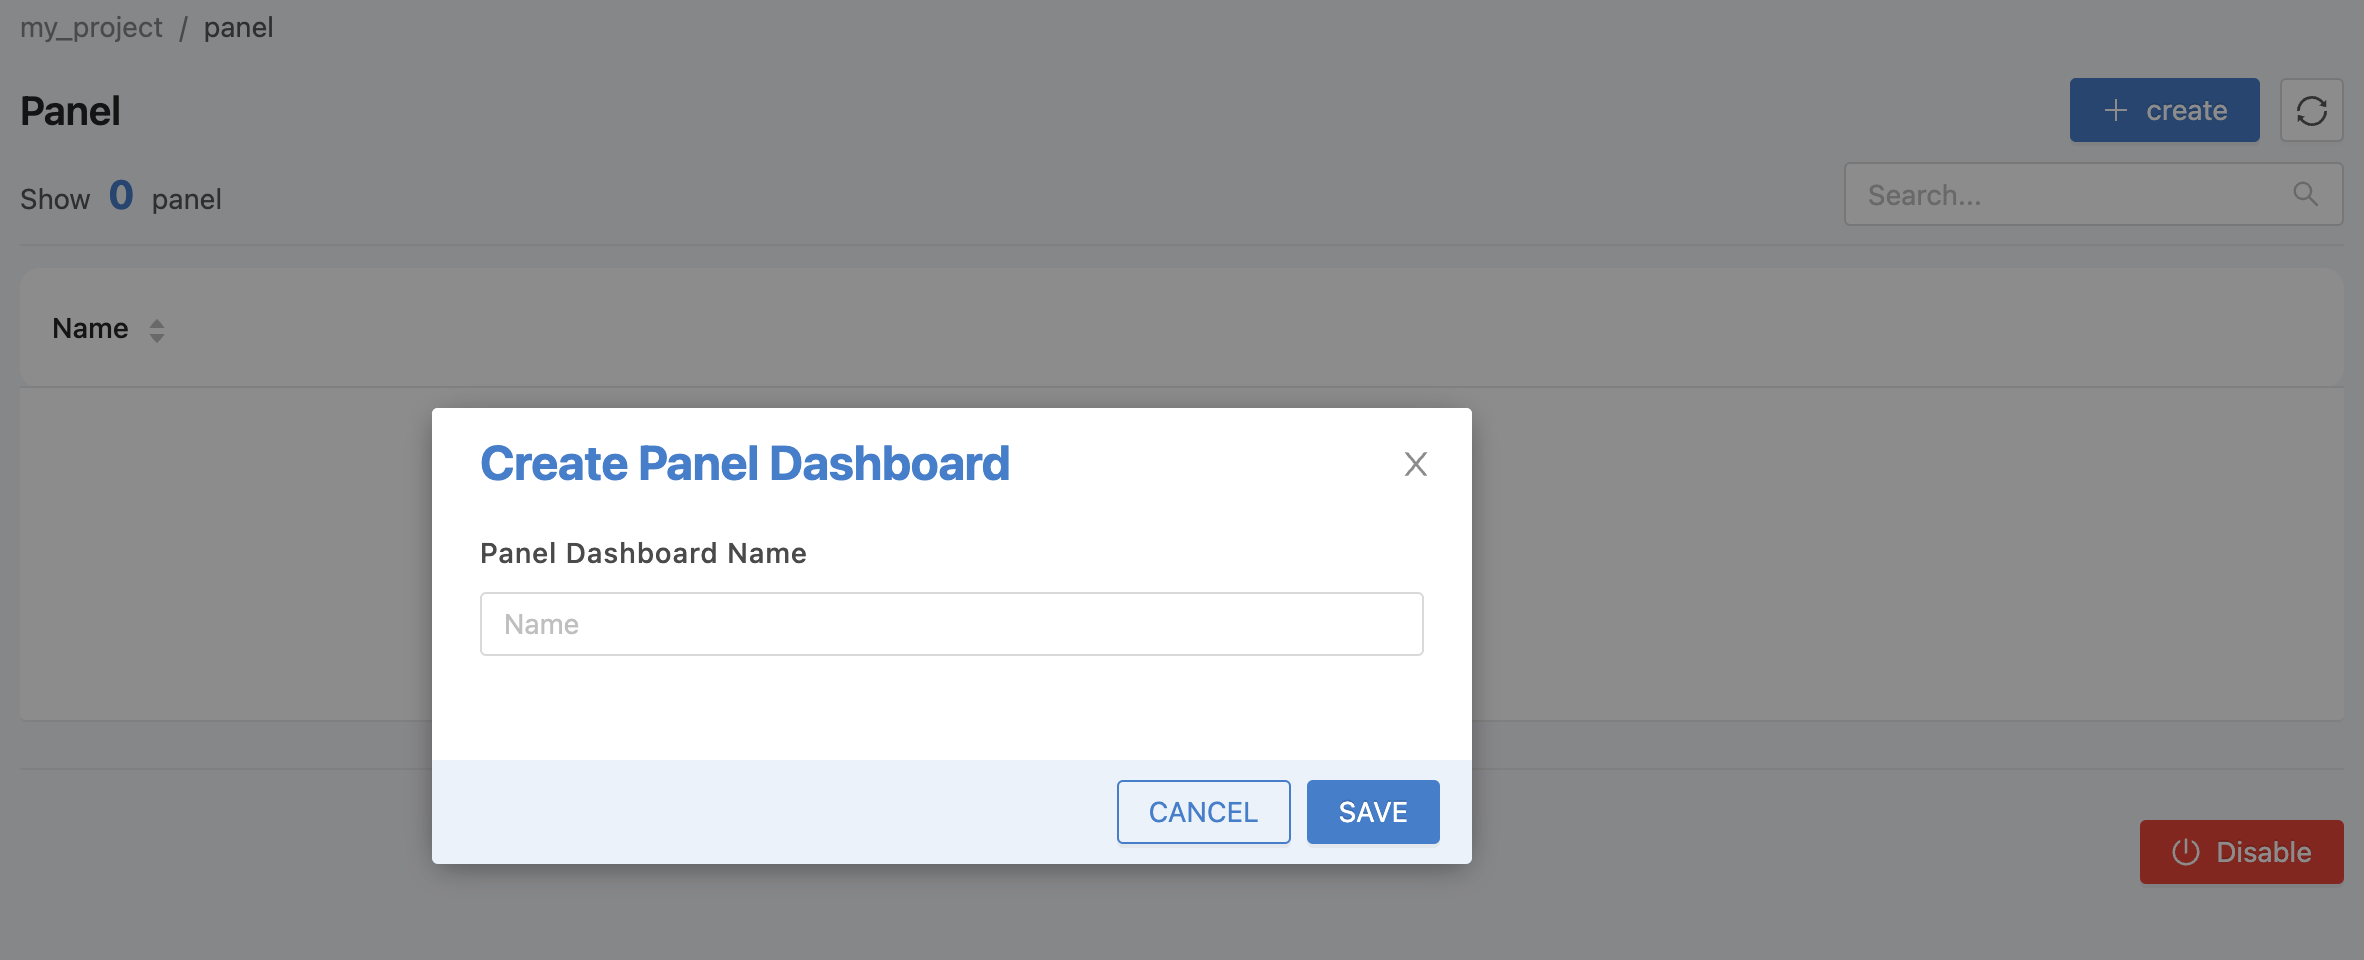
Enter the Panel name. The name must not contain any white space. Once you have filled in the information, click the "SAVE" button. The new Panel list that was just created will appear, as shown in the figure.
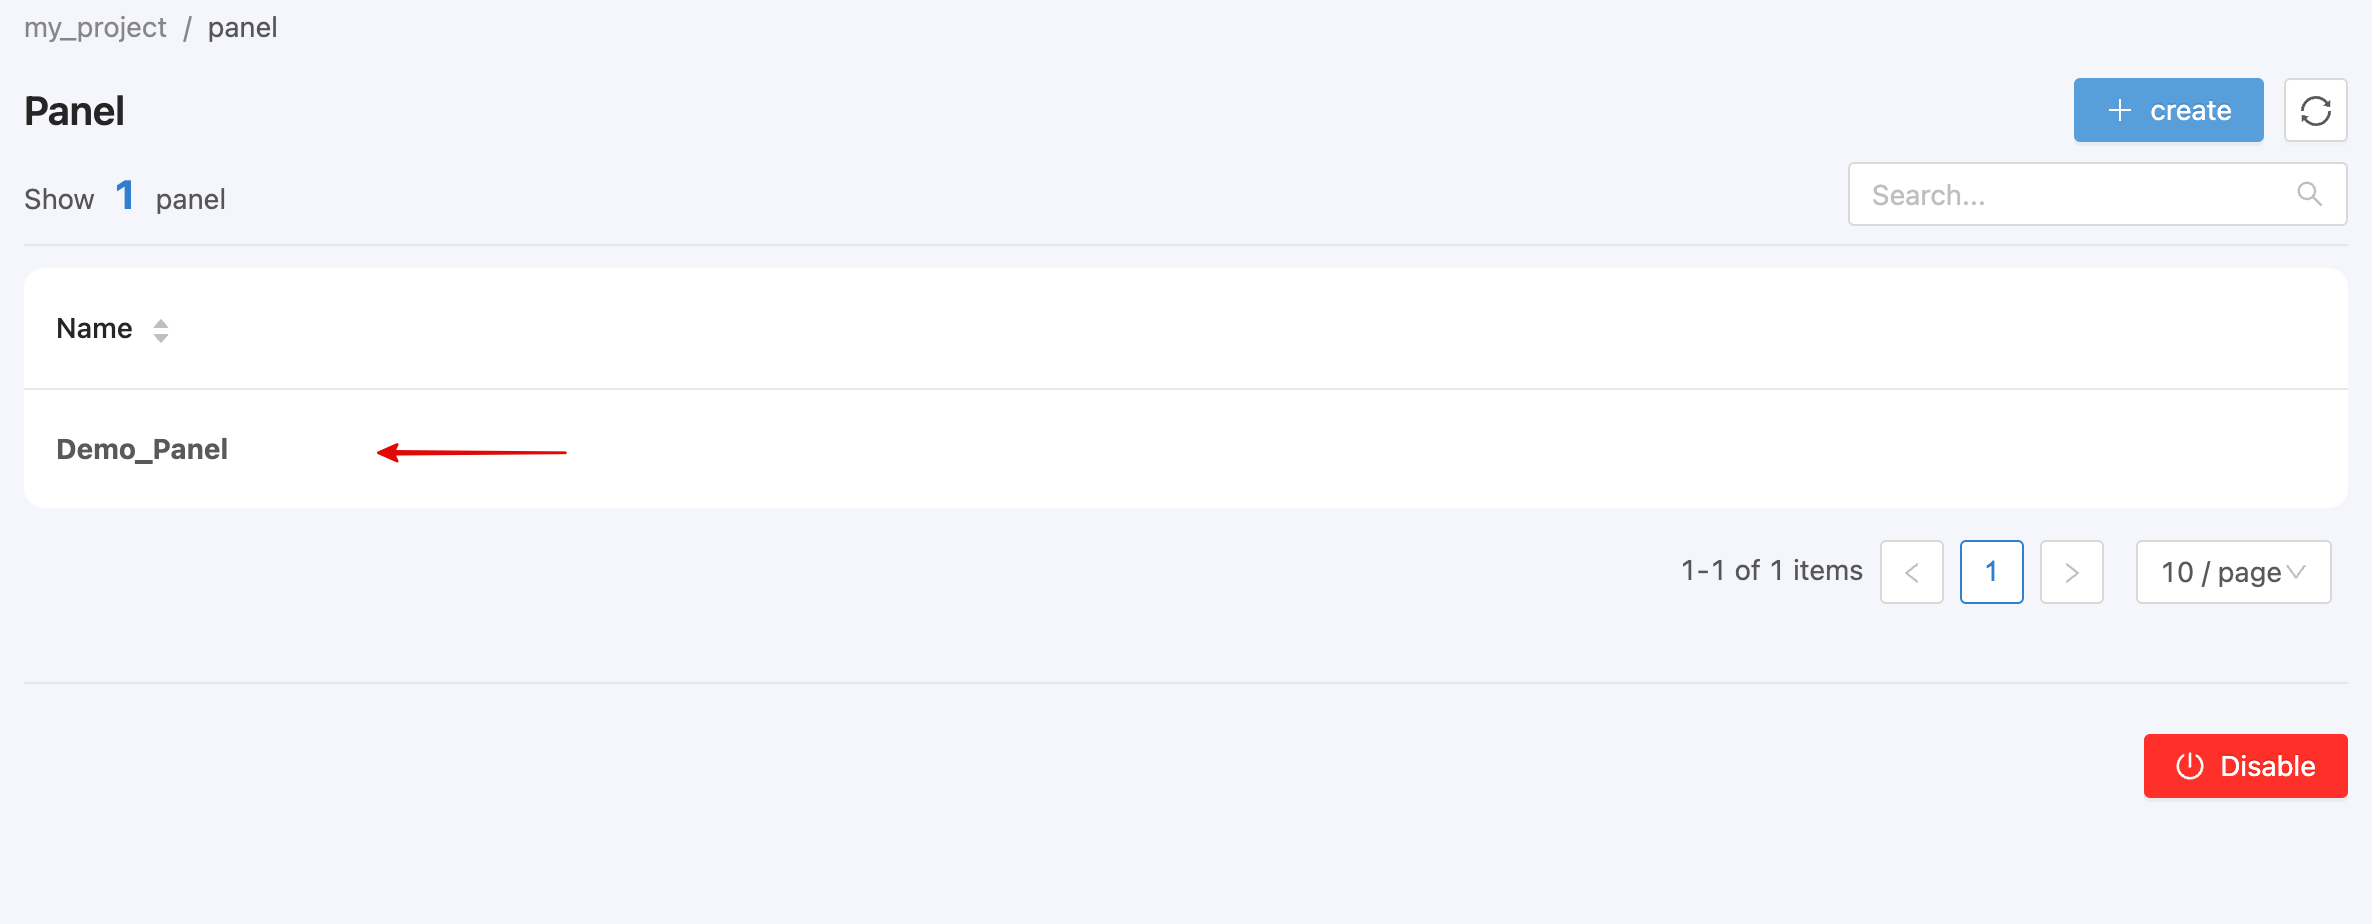
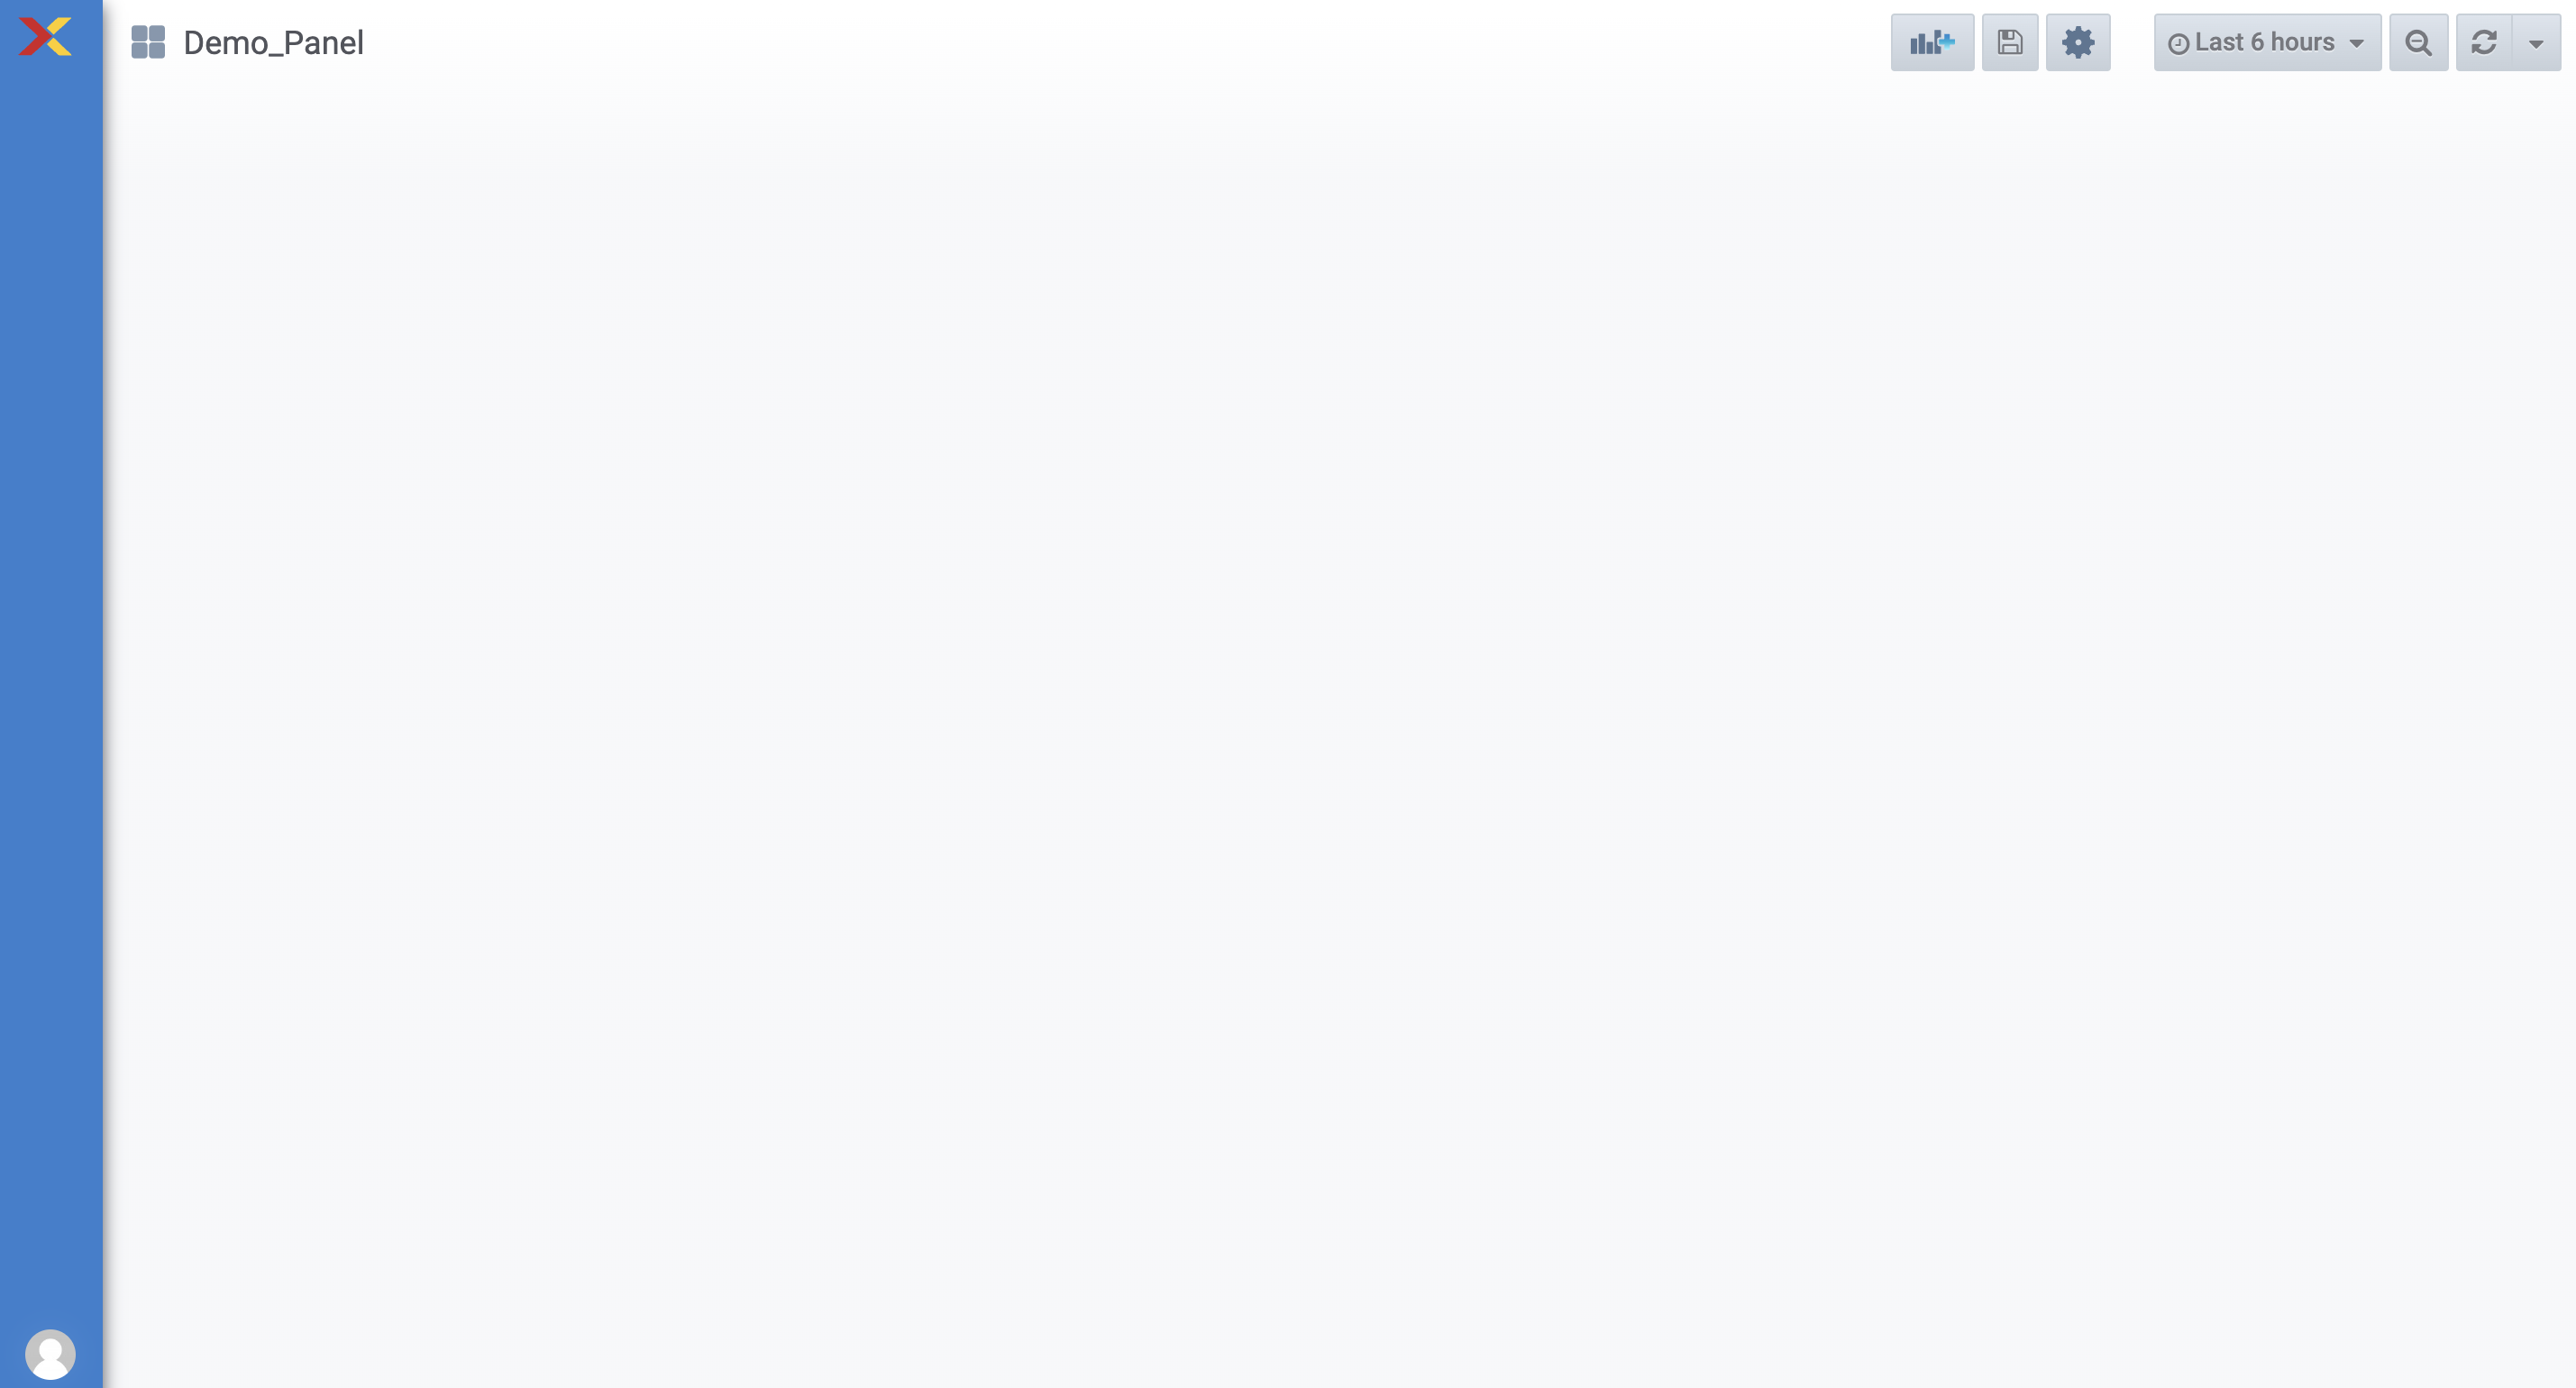
To edit or delete a panel, point the cursor at the panel you want to edit. An icon will appear for you to click to edit or delete that panel. When you click on each panel, the system will take you to the screen for setting up the display or viewing data within the system that has already been set up for visualization, as shown in the figure (For more information on panel settings, please see Panel).
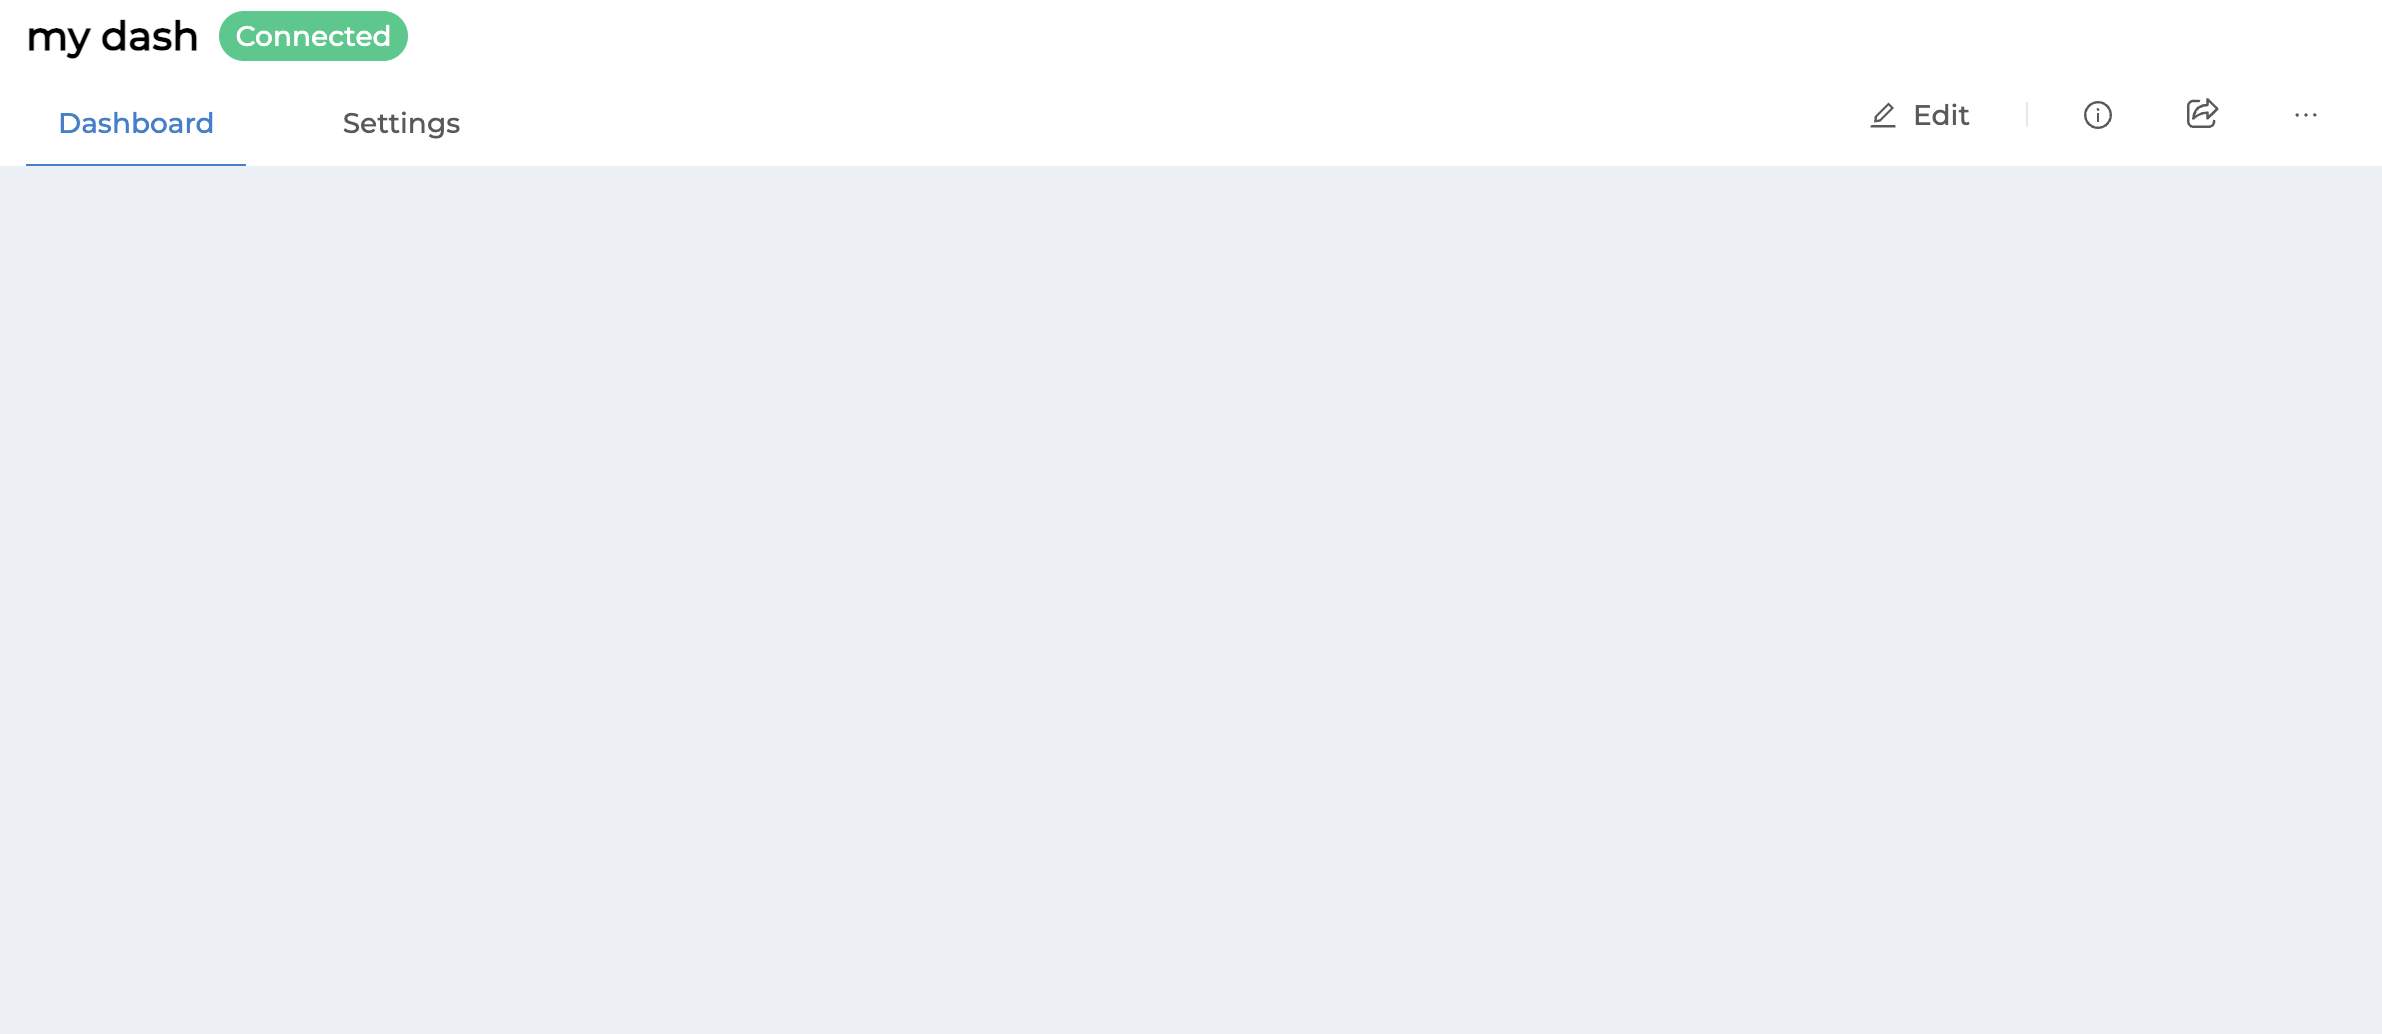
"Dashboard" menu
It is suitable for doing various types of Data Visualization, including supporting control back to the Device. Access by clicking on the "Dashboard" sub-menu in the left menu bar. The screen will appear as shown in the picture.
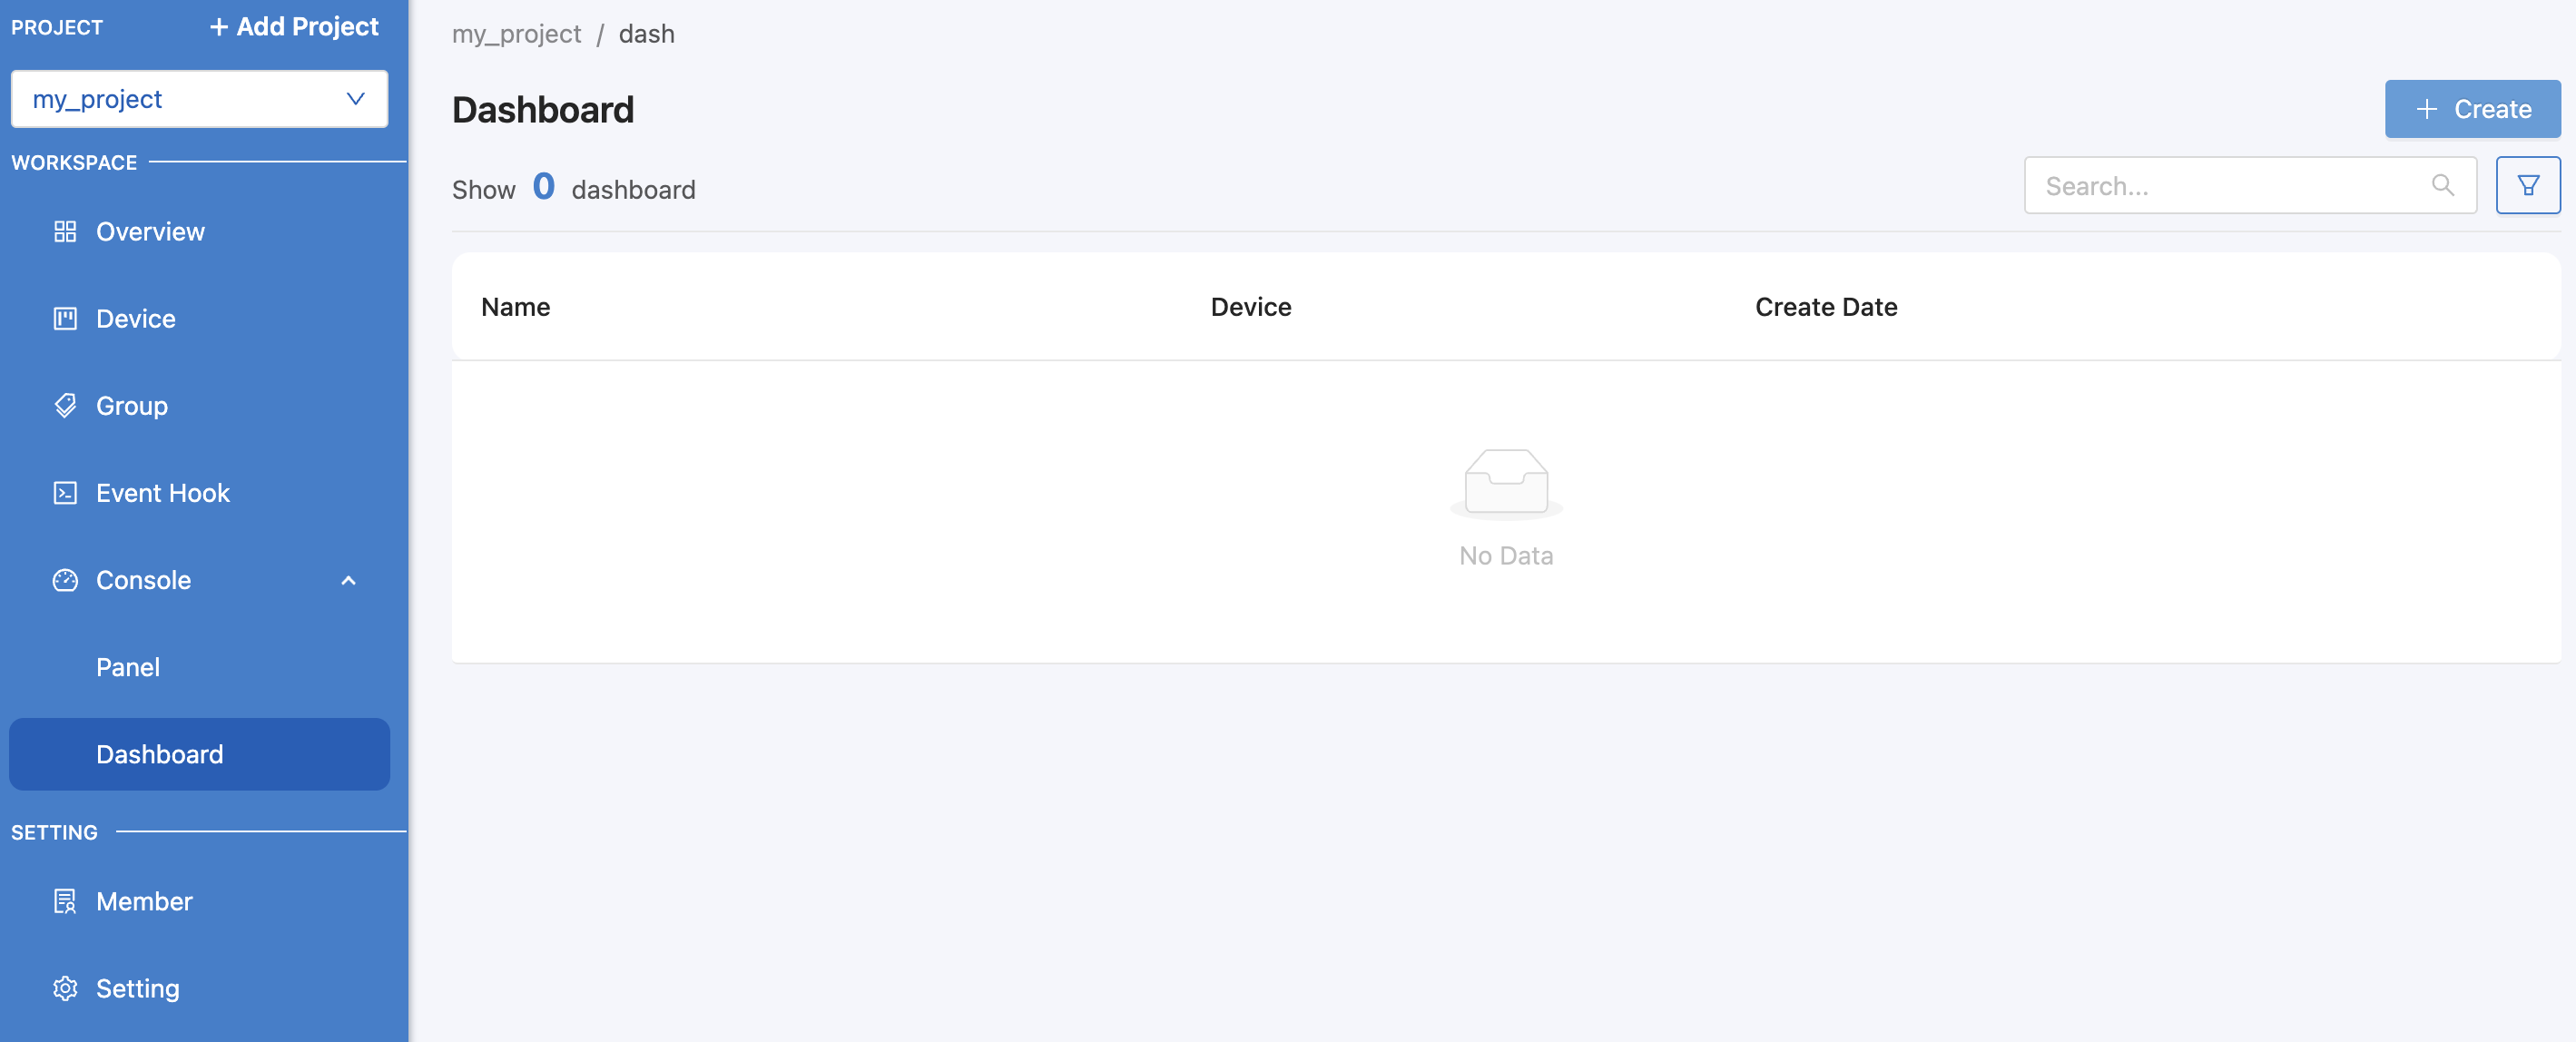
From the image above, you can create a Dashboard by clicking on the "Create" button on the top right corner. When you click on it, a form for filling in information will appear as shown in the image.

From the image above, the Dashboard data that can be identified is as follows:
Dashboard Name |
Dashboard names do not allow white spaces in the name. |
Dashboard Description |
Dashboard Description |
When you have filled in all the information, click on the "SAVE" button, and the new Dashboard that was just created will appear, as shown in the picture.
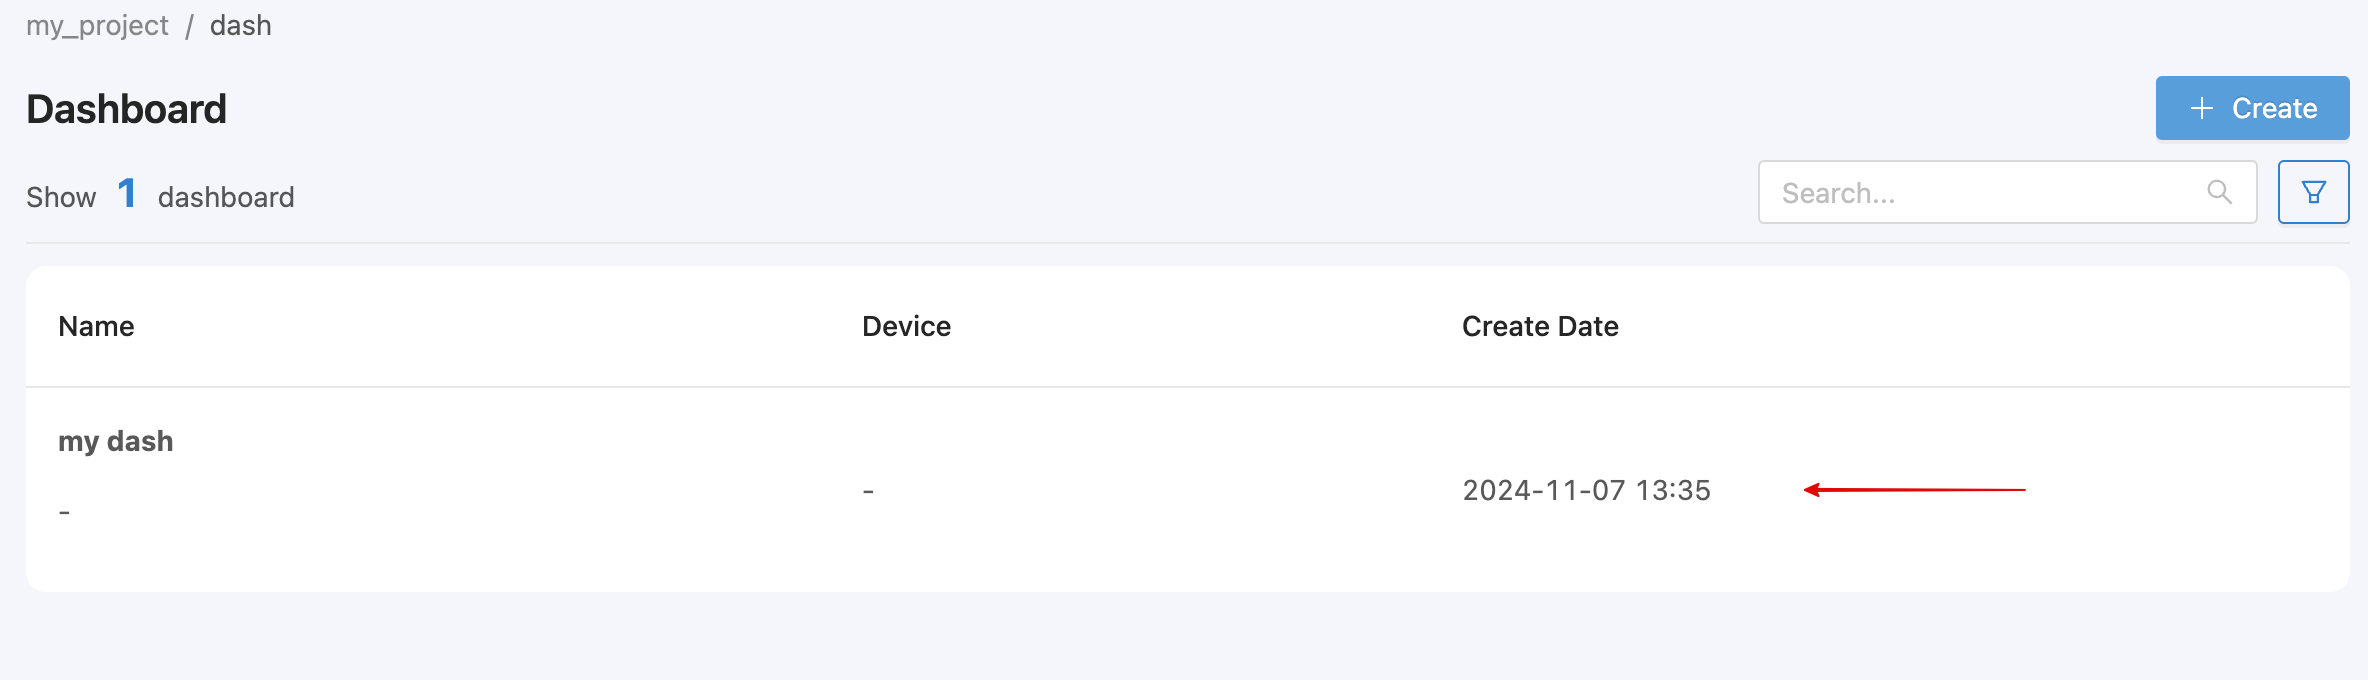
If you want to edit or delete a Dashboard, point the cursor at the Dashboard. The desired action will appear with an icon for clicking to edit or delete that Dashboard. When you click on each item, the Dashboard will go to the screen for setting up the display or viewing data within the system that has already been set up for Visualization, as shown in the figure (For more information on Dashboard settings, please study Dashboard).
Member
Used to manage the rights of those who have access to the Project. People who have access to the Project can be added according to different roles. It is divided into 5 levels as follows:
Permission/Role |
Guest |
Viewer |
Editor |
Master |
Owner |
|---|---|---|---|---|---|
Read Device Info |
X |
X |
X |
X |
X |
Read Device Status |
X |
X |
X |
X |
X |
Read Shadow |
X |
X |
X |
X |
|
Read Schema |
X |
X |
X |
||
Read Trigger |
X |
X |
X |
||
Read Event Hook |
X |
X |
X |
||
Write Device Info |
X |
X |
X |
||
Write Shadow |
X |
X |
X |
||
Write Schema |
X |
X |
X |
||
Write Trigger |
X |
X |
X |
||
Write Event Hook |
X |
X |
X |
||
Create Device |
X |
X |
|||
Create Group |
X |
X |
|||
Delete Device |
X |
X |
|||
Delete Group |
X |
X |
|||
Invite User to Project |
X |
||||
Remove User from Project |
X |
||||
Remove Project |
X |
For Owner, you cannot add permissions to other users. Only the user who created the Project will have this permission. To add permissions to other users to access the Project, those users must have an account to use the system. Then click the Invite button on the top right corner. The screen will appear as shown in the image below.
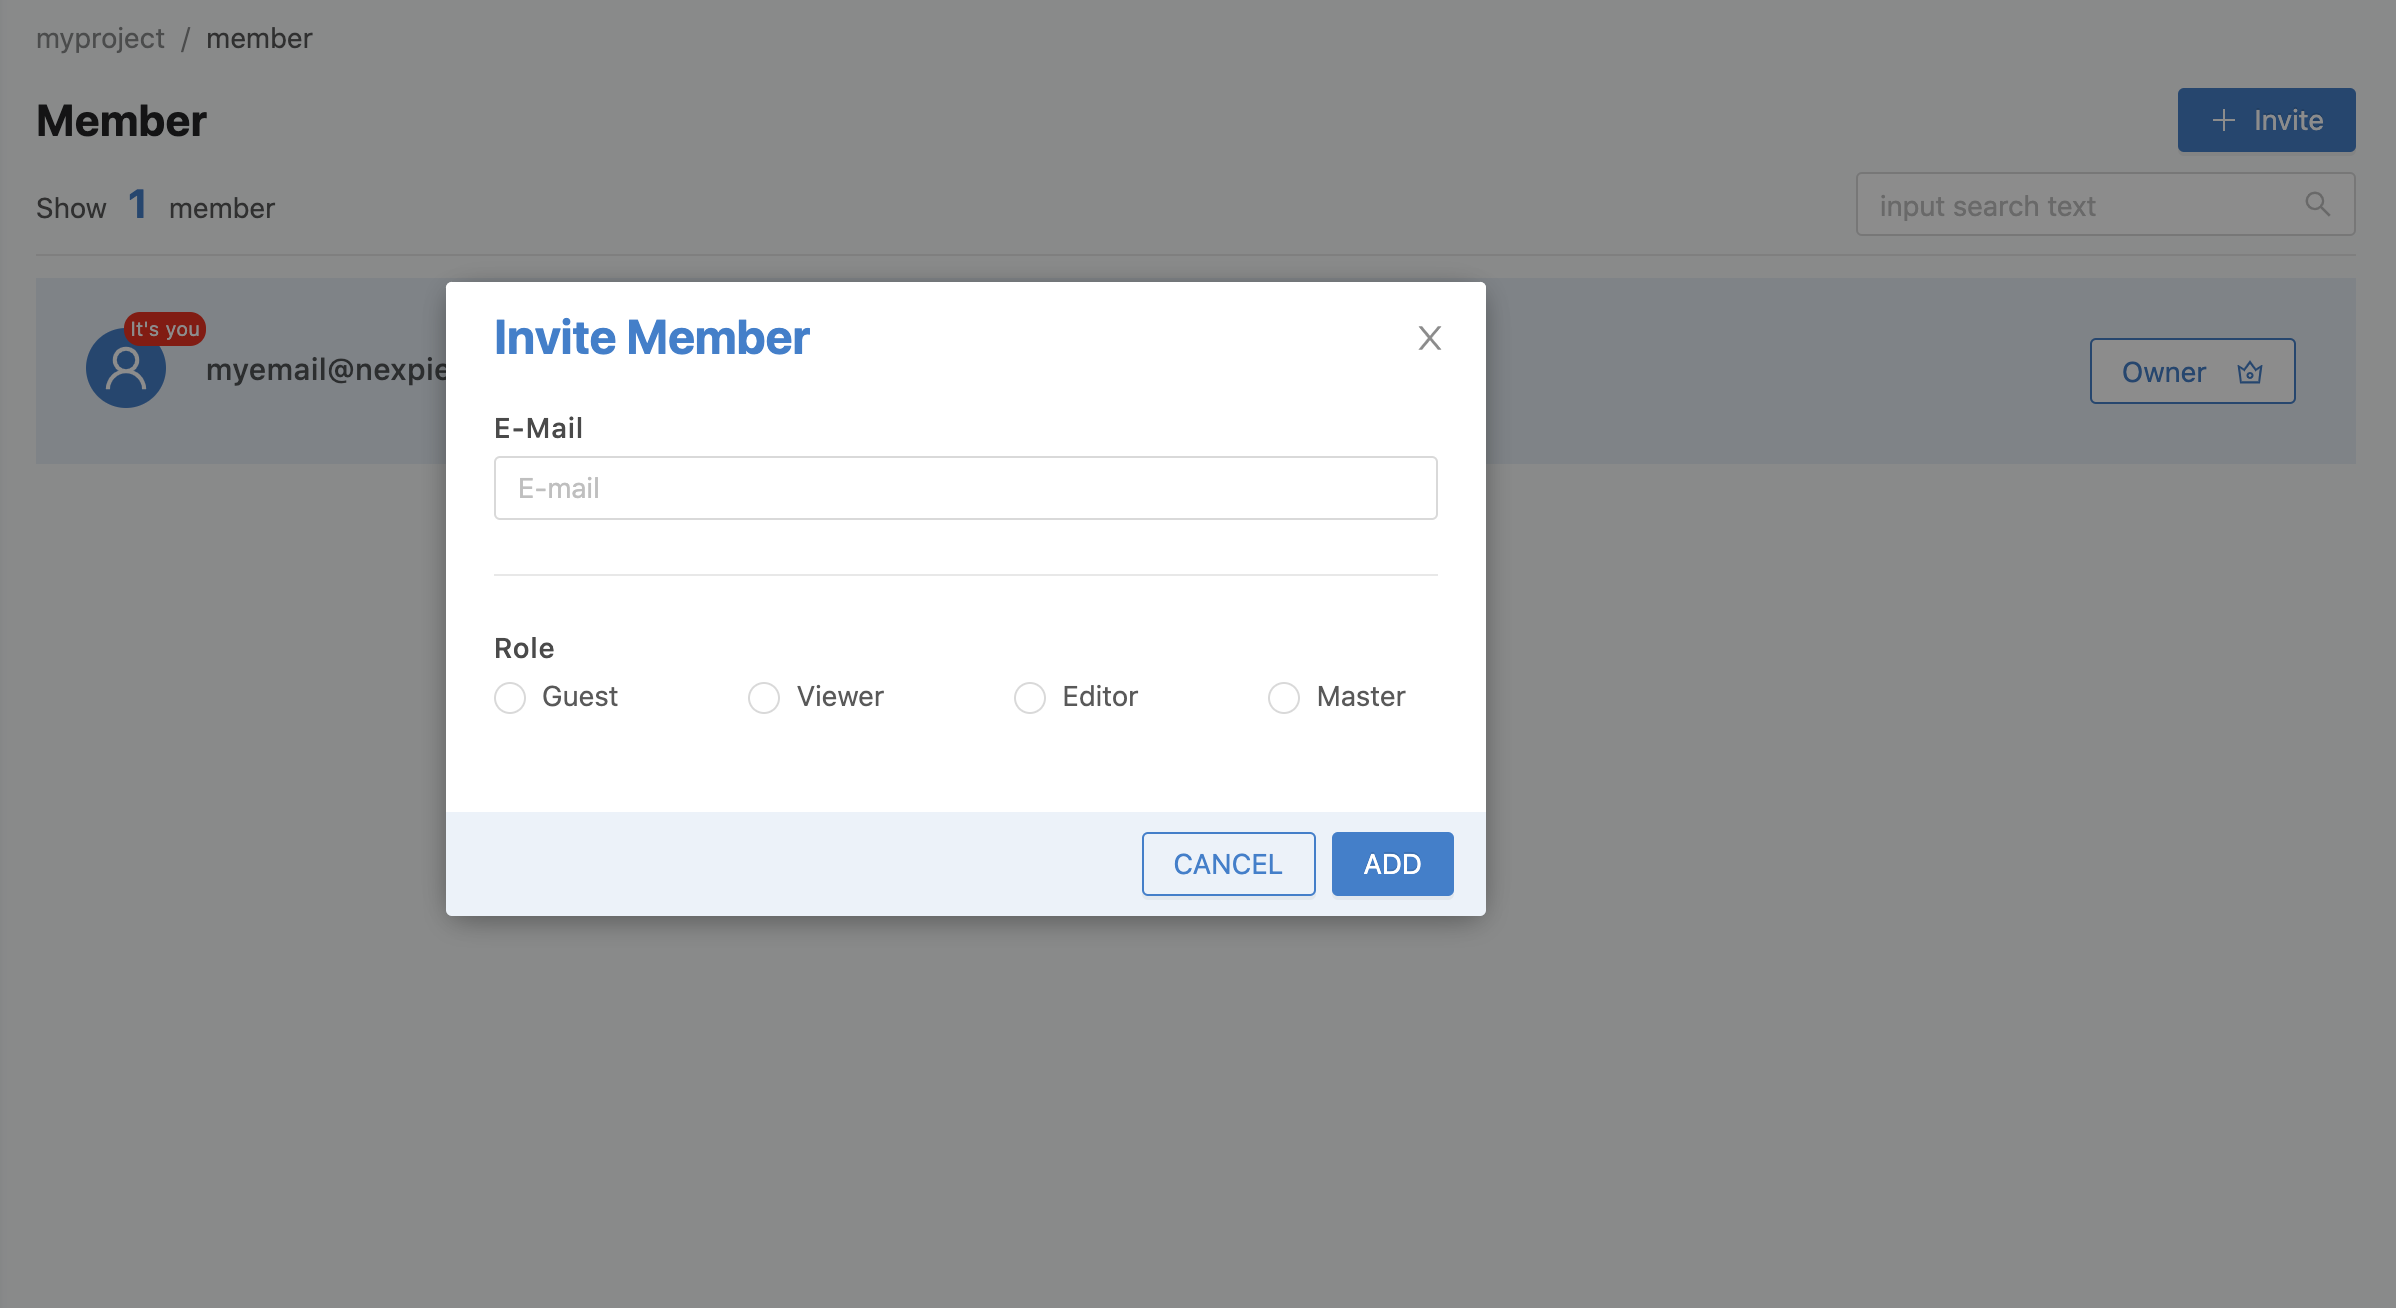
From the image above, the Invite Member information that must be specified is as follows:
Email or User Account to grant permissions |
|
Role |
Roles and responsibilities that need to be granted |
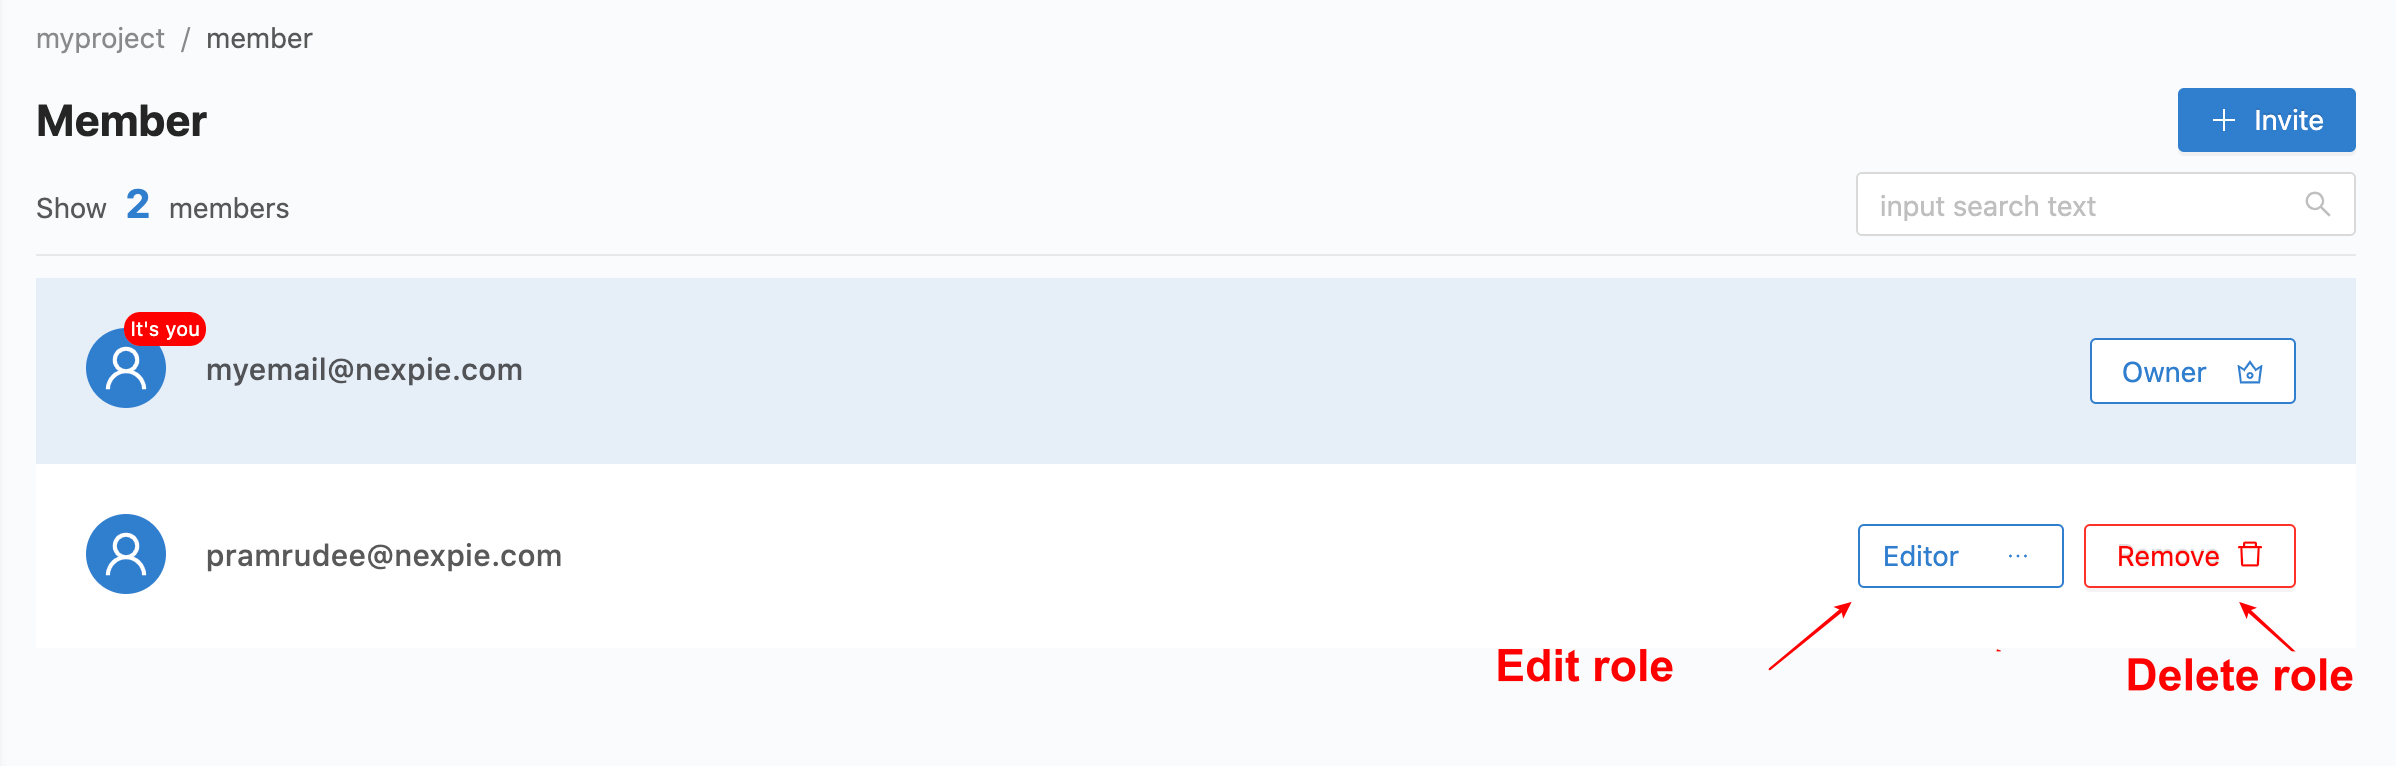
When you have filled in all the information, click on the "ADD" button, and a list of new members that have been granted rights will appear, as shown in the picture.
Note
Adding permissions to other users
The email address to be used to record access rights to various projects in the Platform must be an email address that has been registered in the Platform. The system will then allow data recording.
Setting
This is a section for managing general information of the Project. Click on the "Settings" menu in the left menu bar, and the page for editing Project information will appear as shown in the figure.
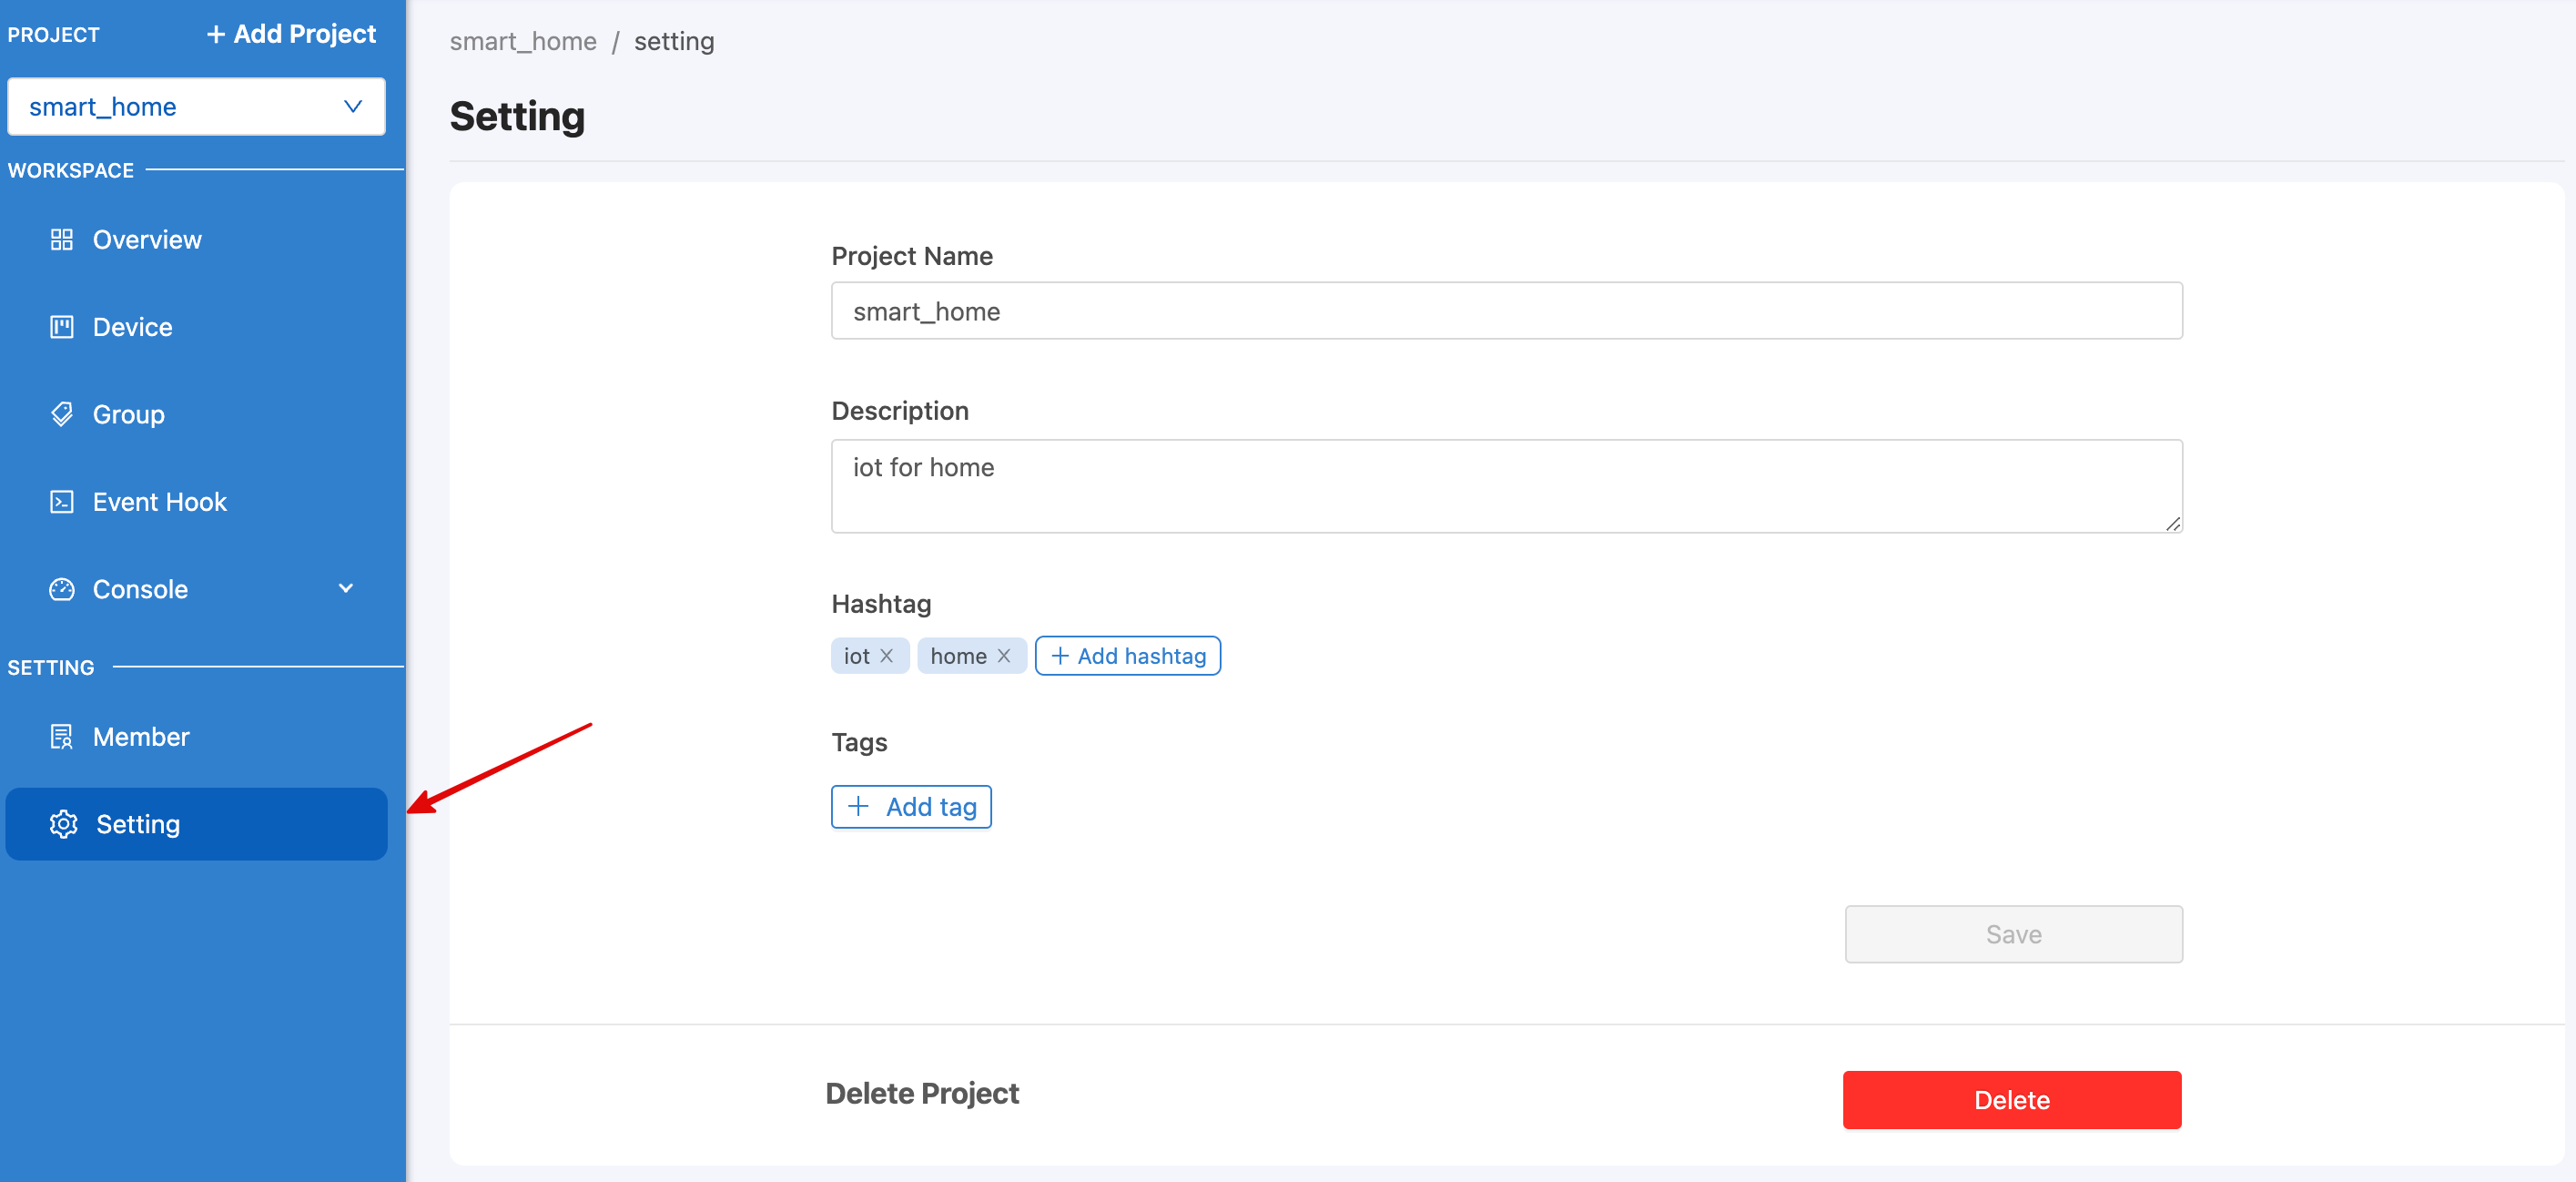
From the image above, in addition to editing general information of the Project, you can also delete the Project from here by clicking on the "Delete" button.
Note
Projects that can be deleted must first be deleted with all data under that project, such as Device Group, before the system will allow deletion of the project.