Panel
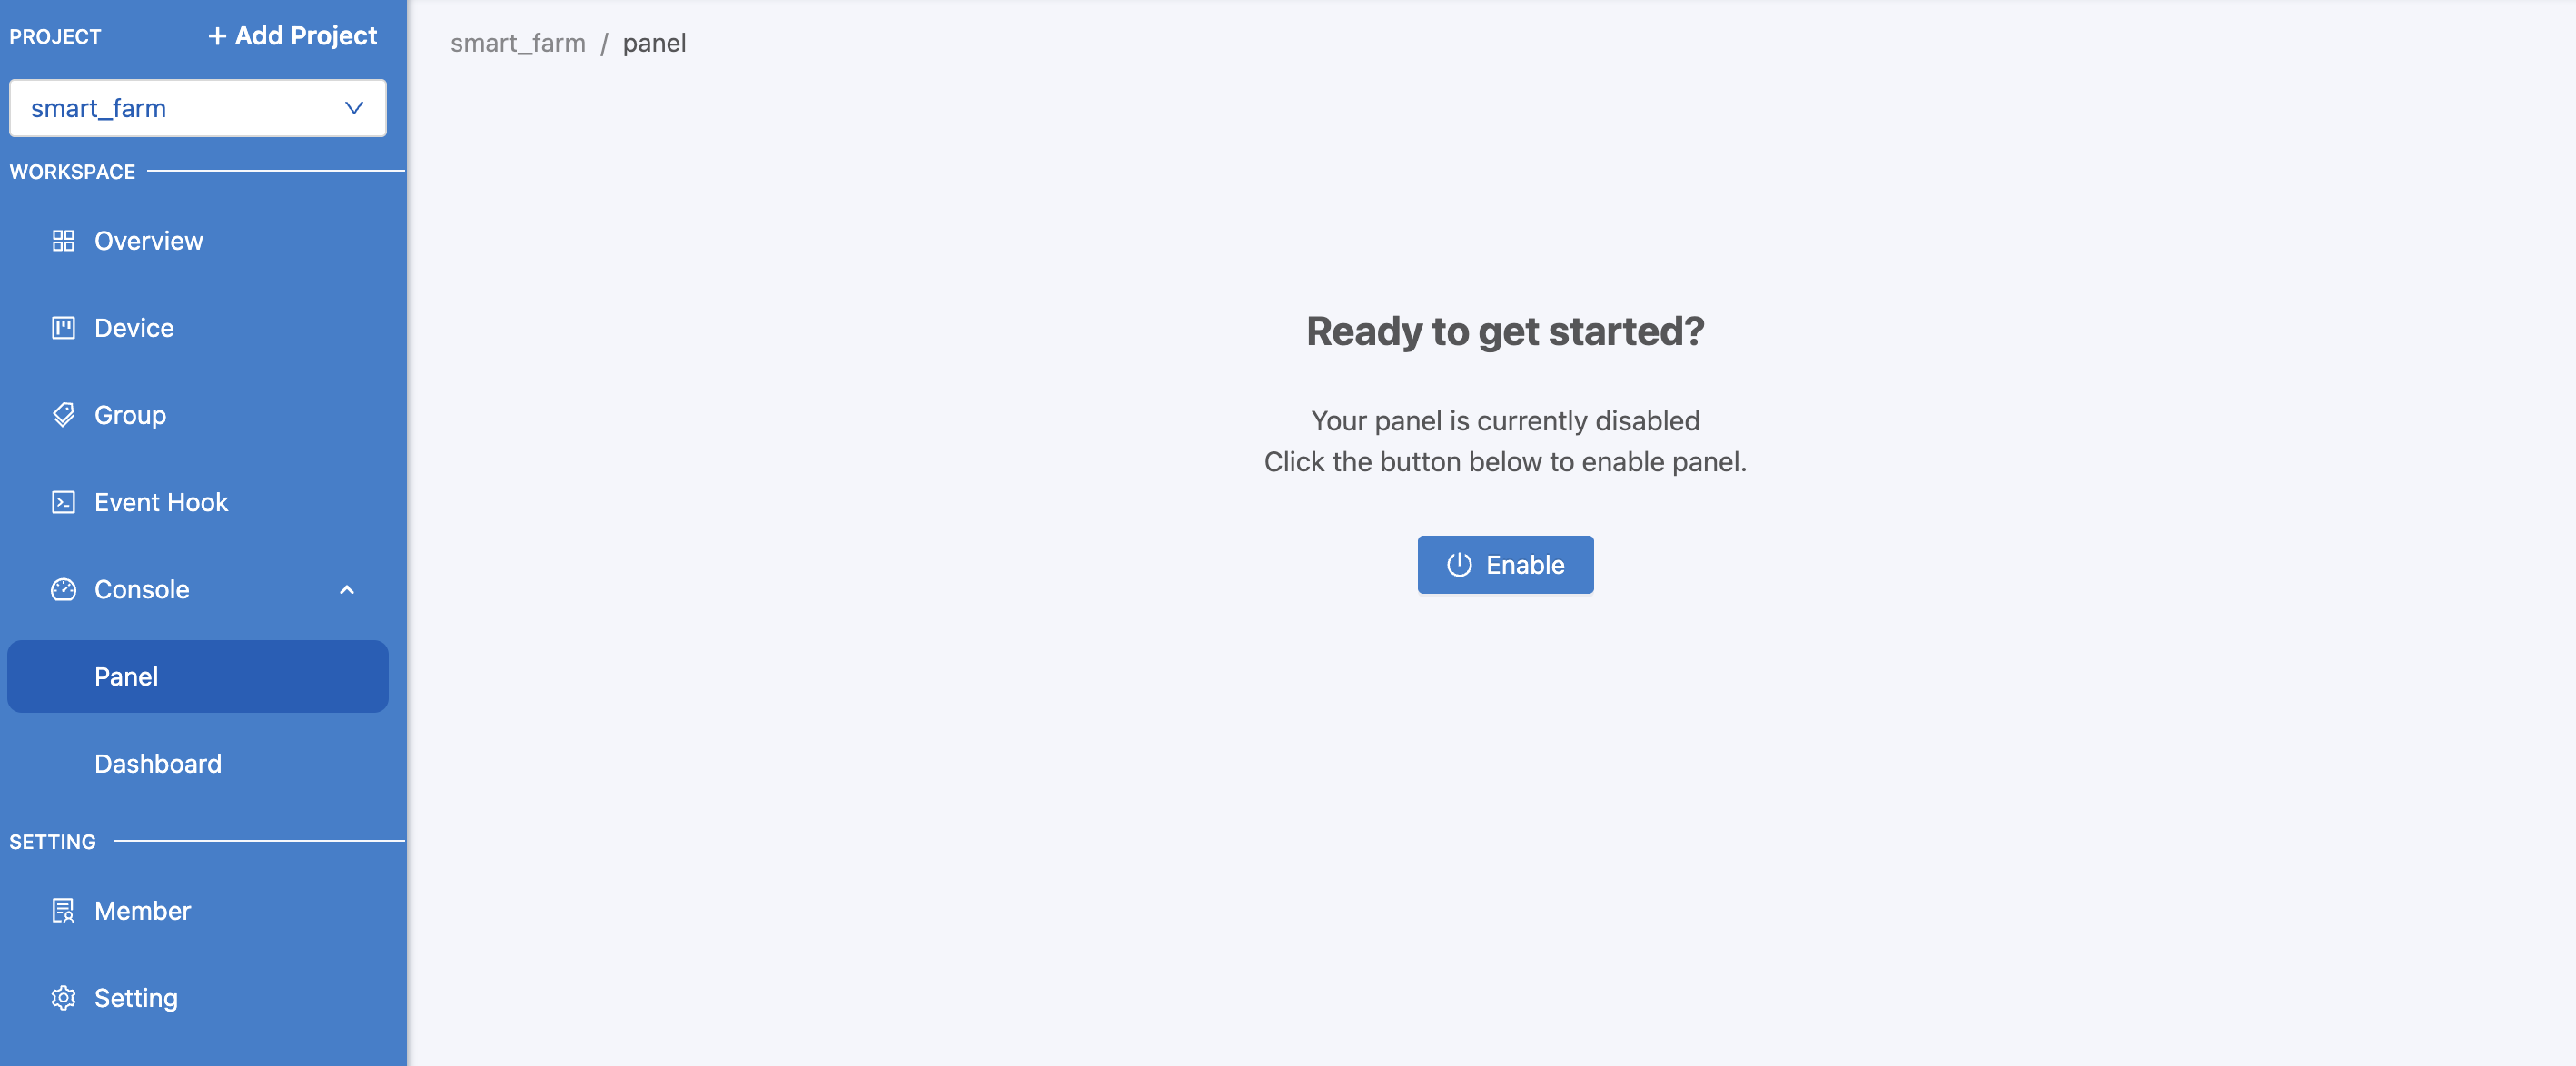
This section is about using Grafana, an open source dashboard, with the platform. It is used as a dashboard for users to display data values that are sent to the platform. It can be customized as needed and for the appropriateness of the data. To access the panel, click on the Console > Panel menu. If this is the first time you are accessing each project, you must press the "Enable" button to enable it first, as shown in the following figure.
Create Panel
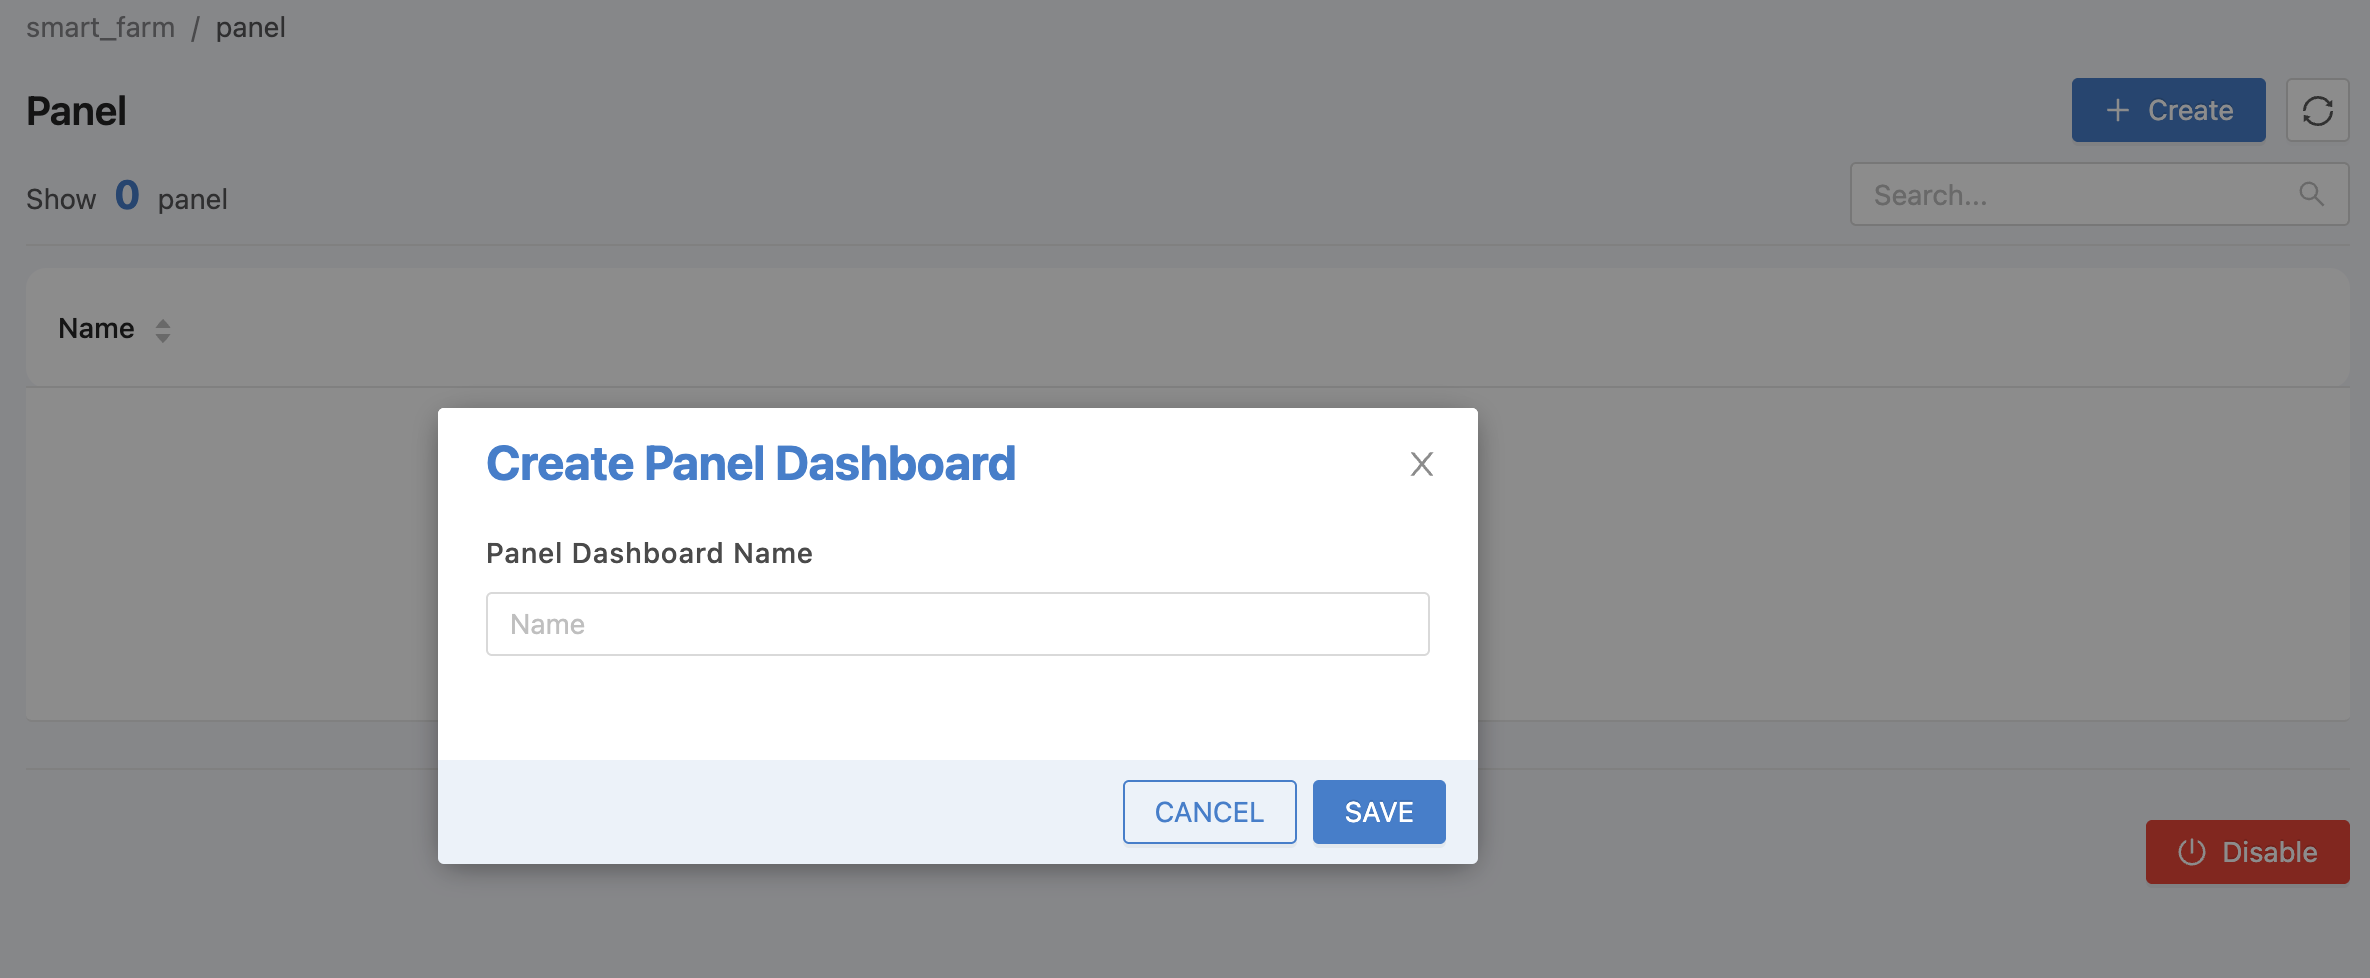
Click on the "Create" button to create a Panel. A form will appear to enter the name of the Panel, as shown in the figure.
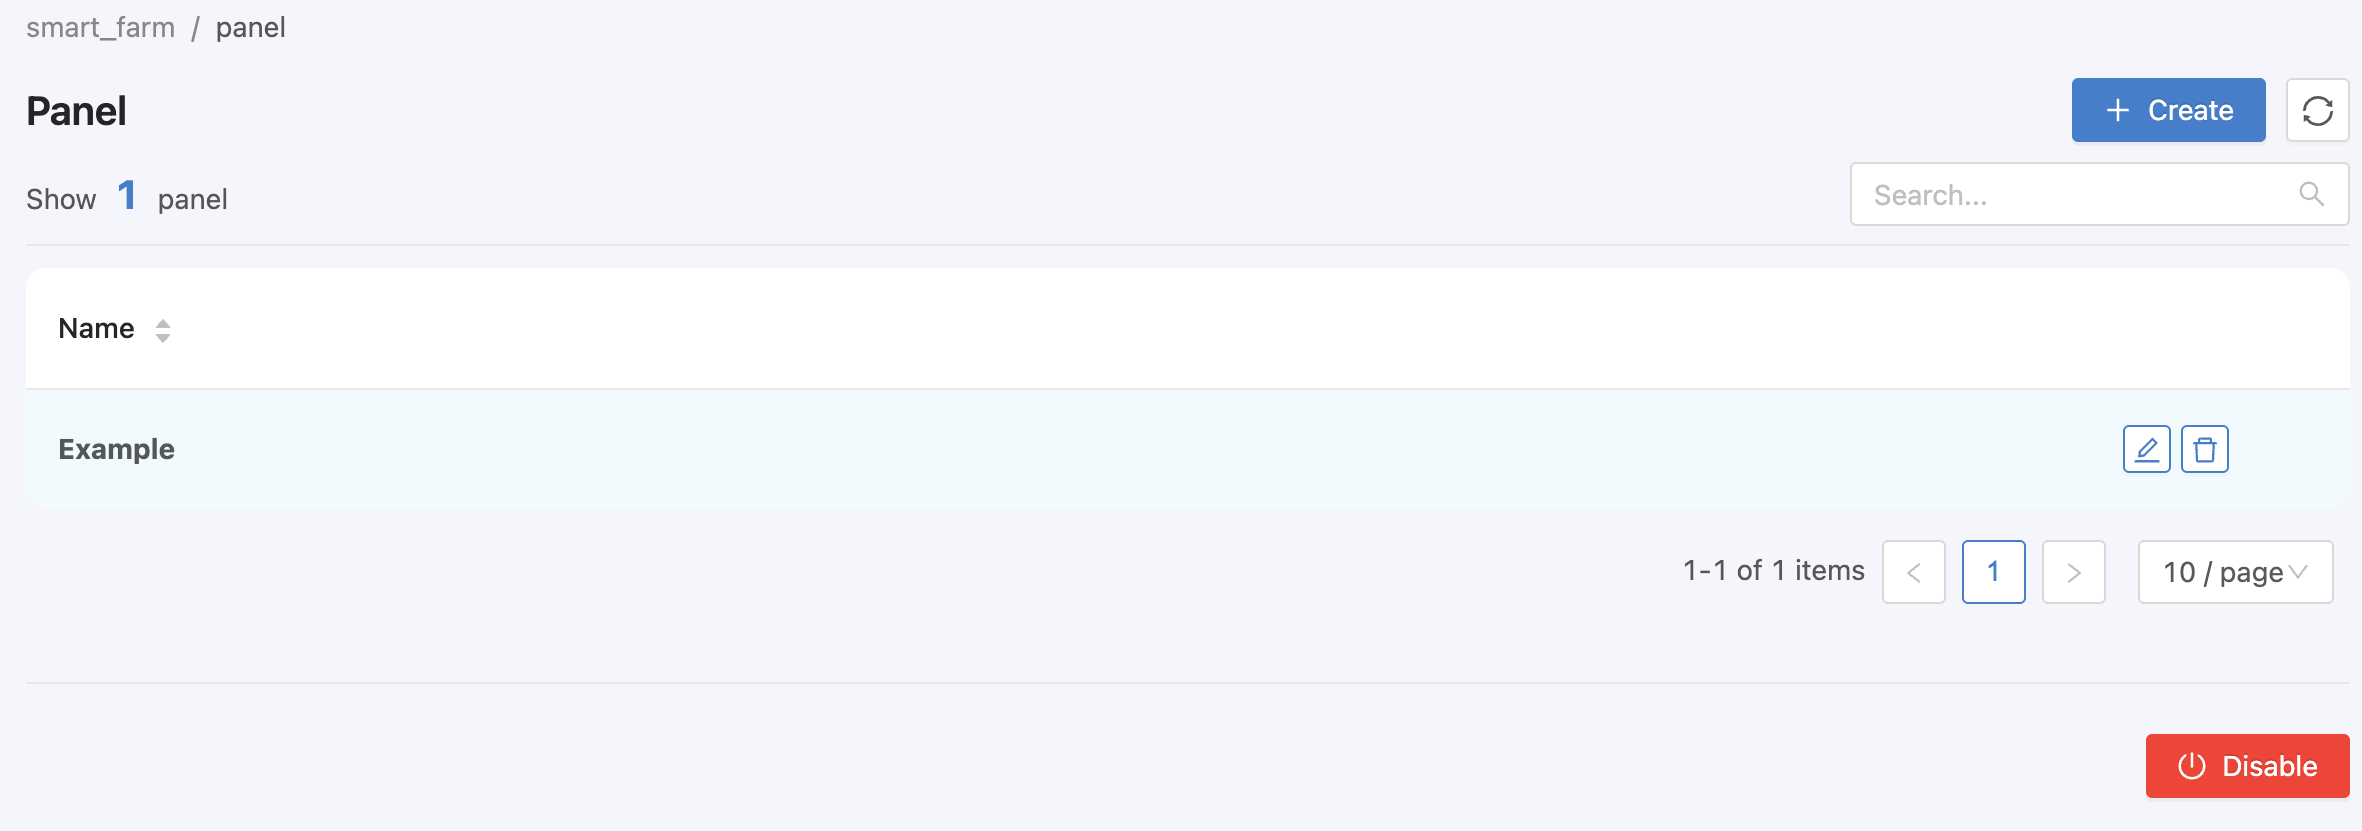
Fill in the Panel Dashboard Name without allowing white spaces in the name. When you have finished filling in the information, press the "SAVE" button and the new Panel list that you have just created will appear. If you want to edit the name or delete the created list, when you hover your mouse over the list, the "Edit" and "Delete" icons will appear after the list so you can click to proceed as shown in the picture.
To set the display of the Panel, click on each created Panel item to enter the operation screen as shown in the figure.
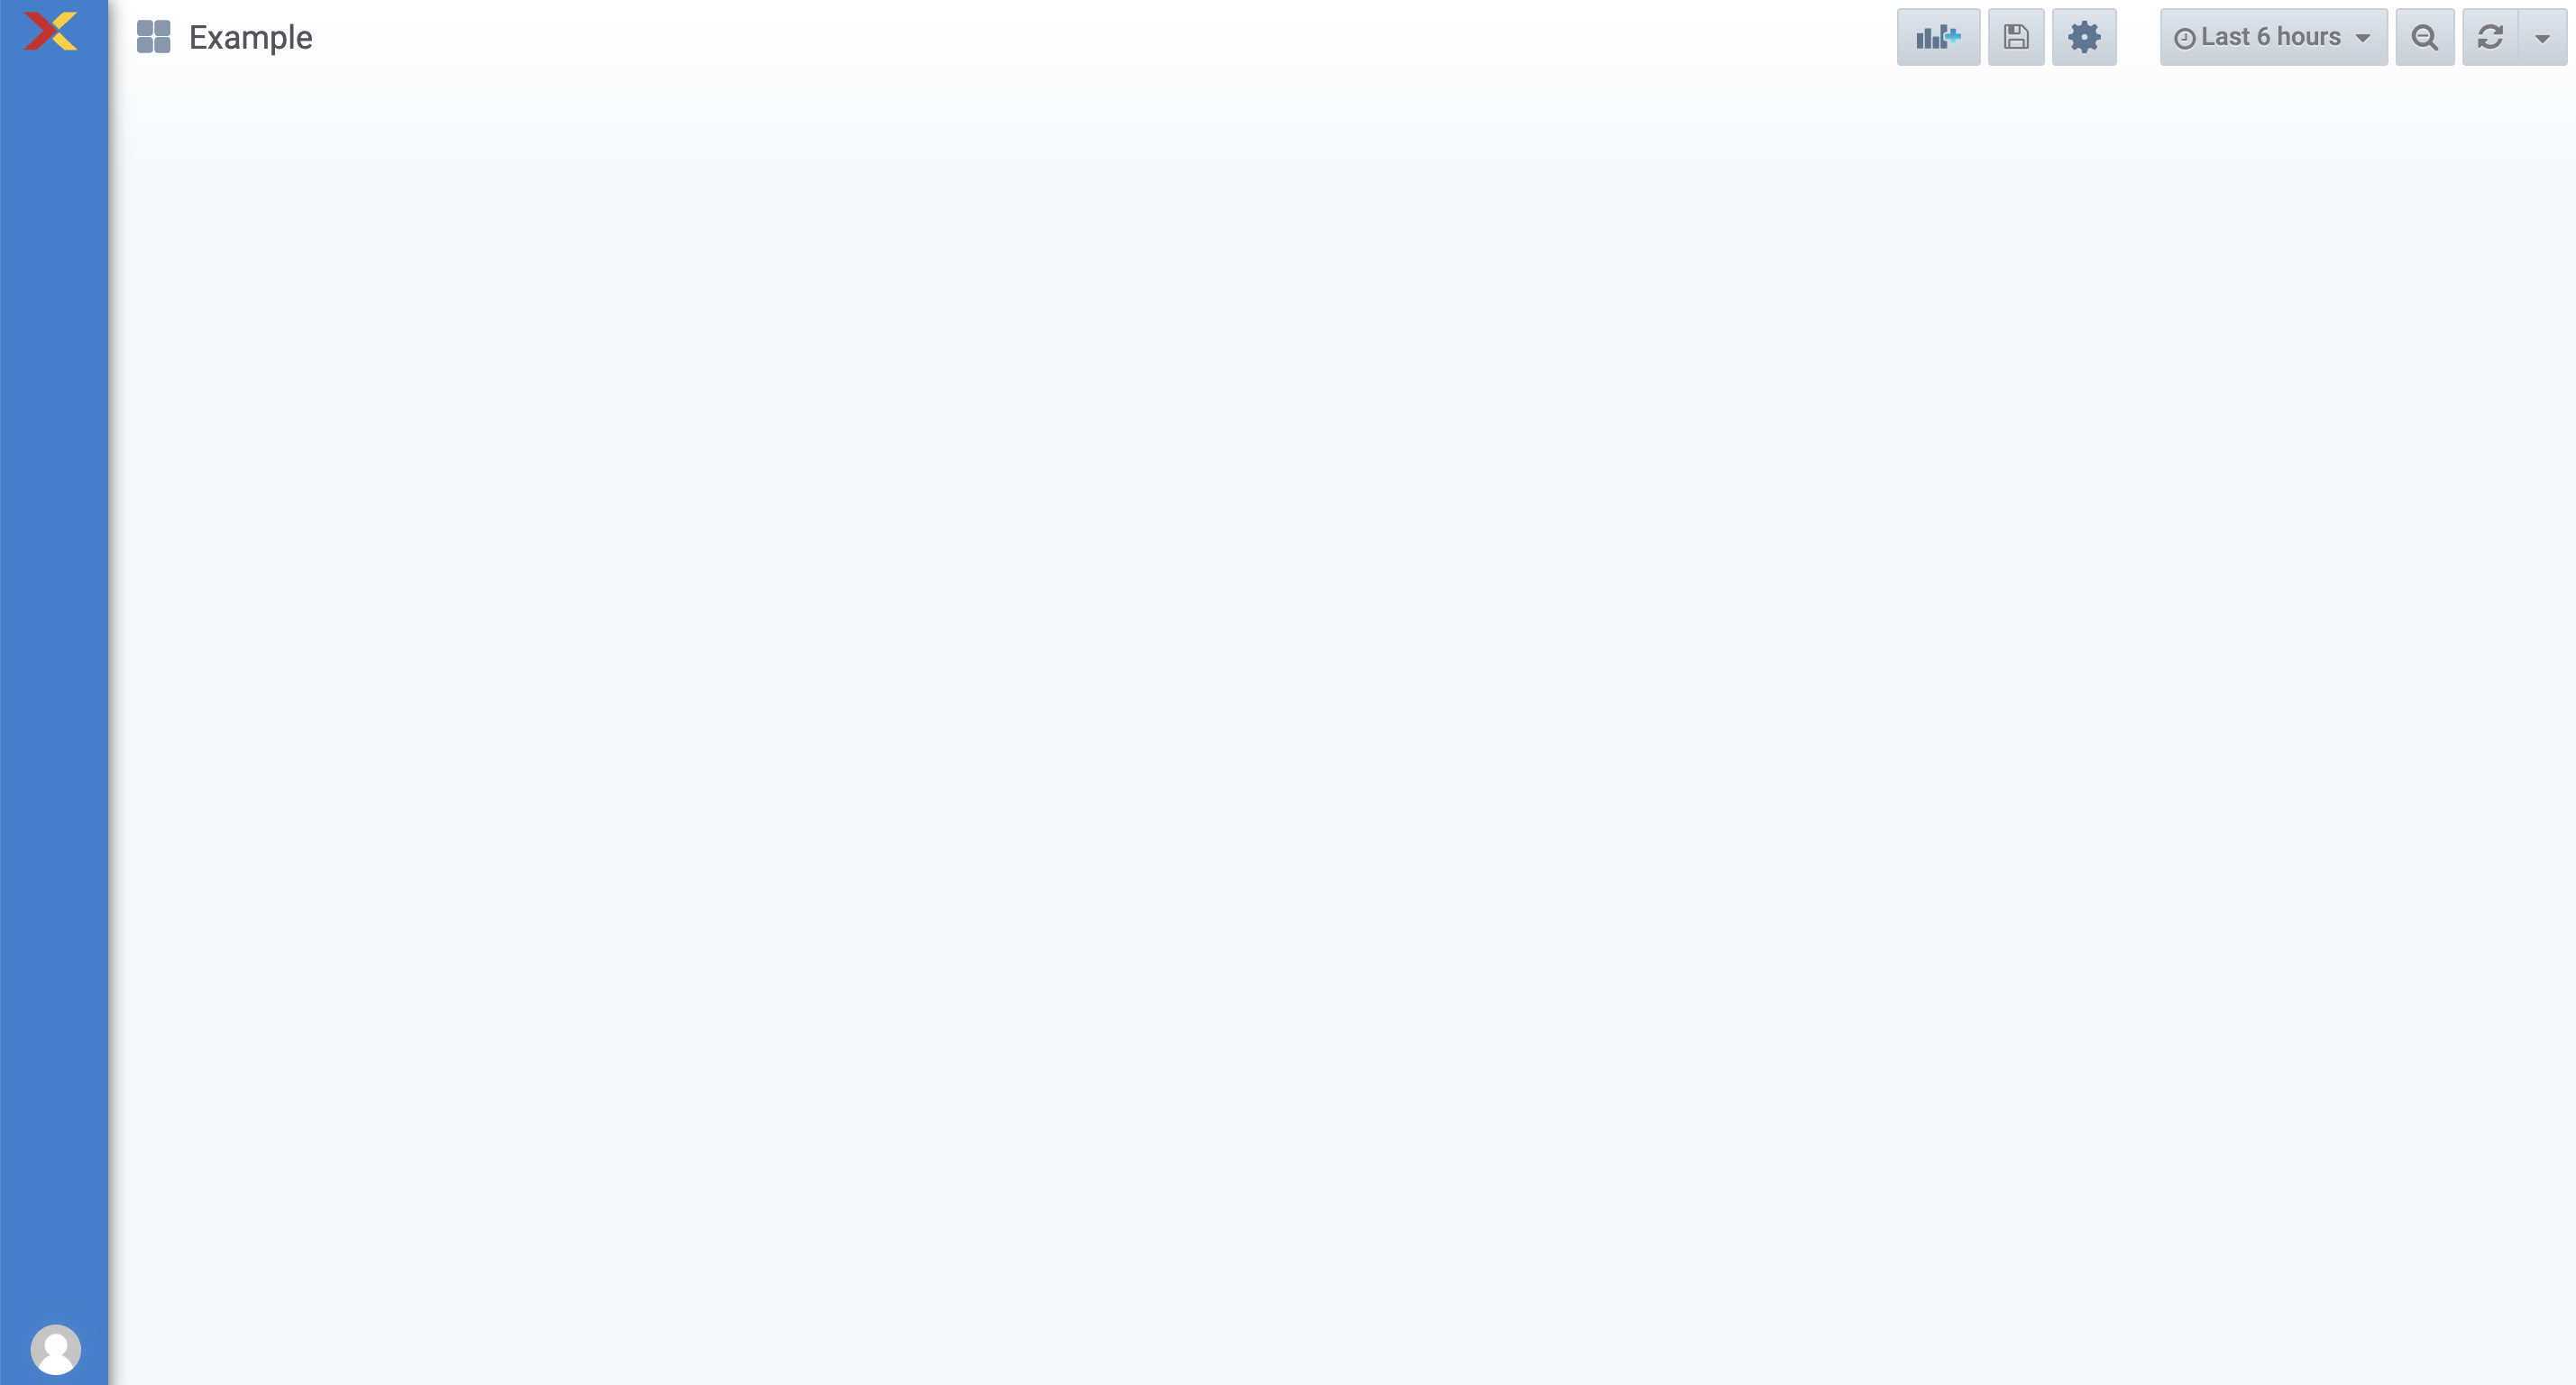
Panel Settings
Click on the "Add panel" button on the top right corner to open the workspace for setting up the data source and visualization format as shown in the figure.
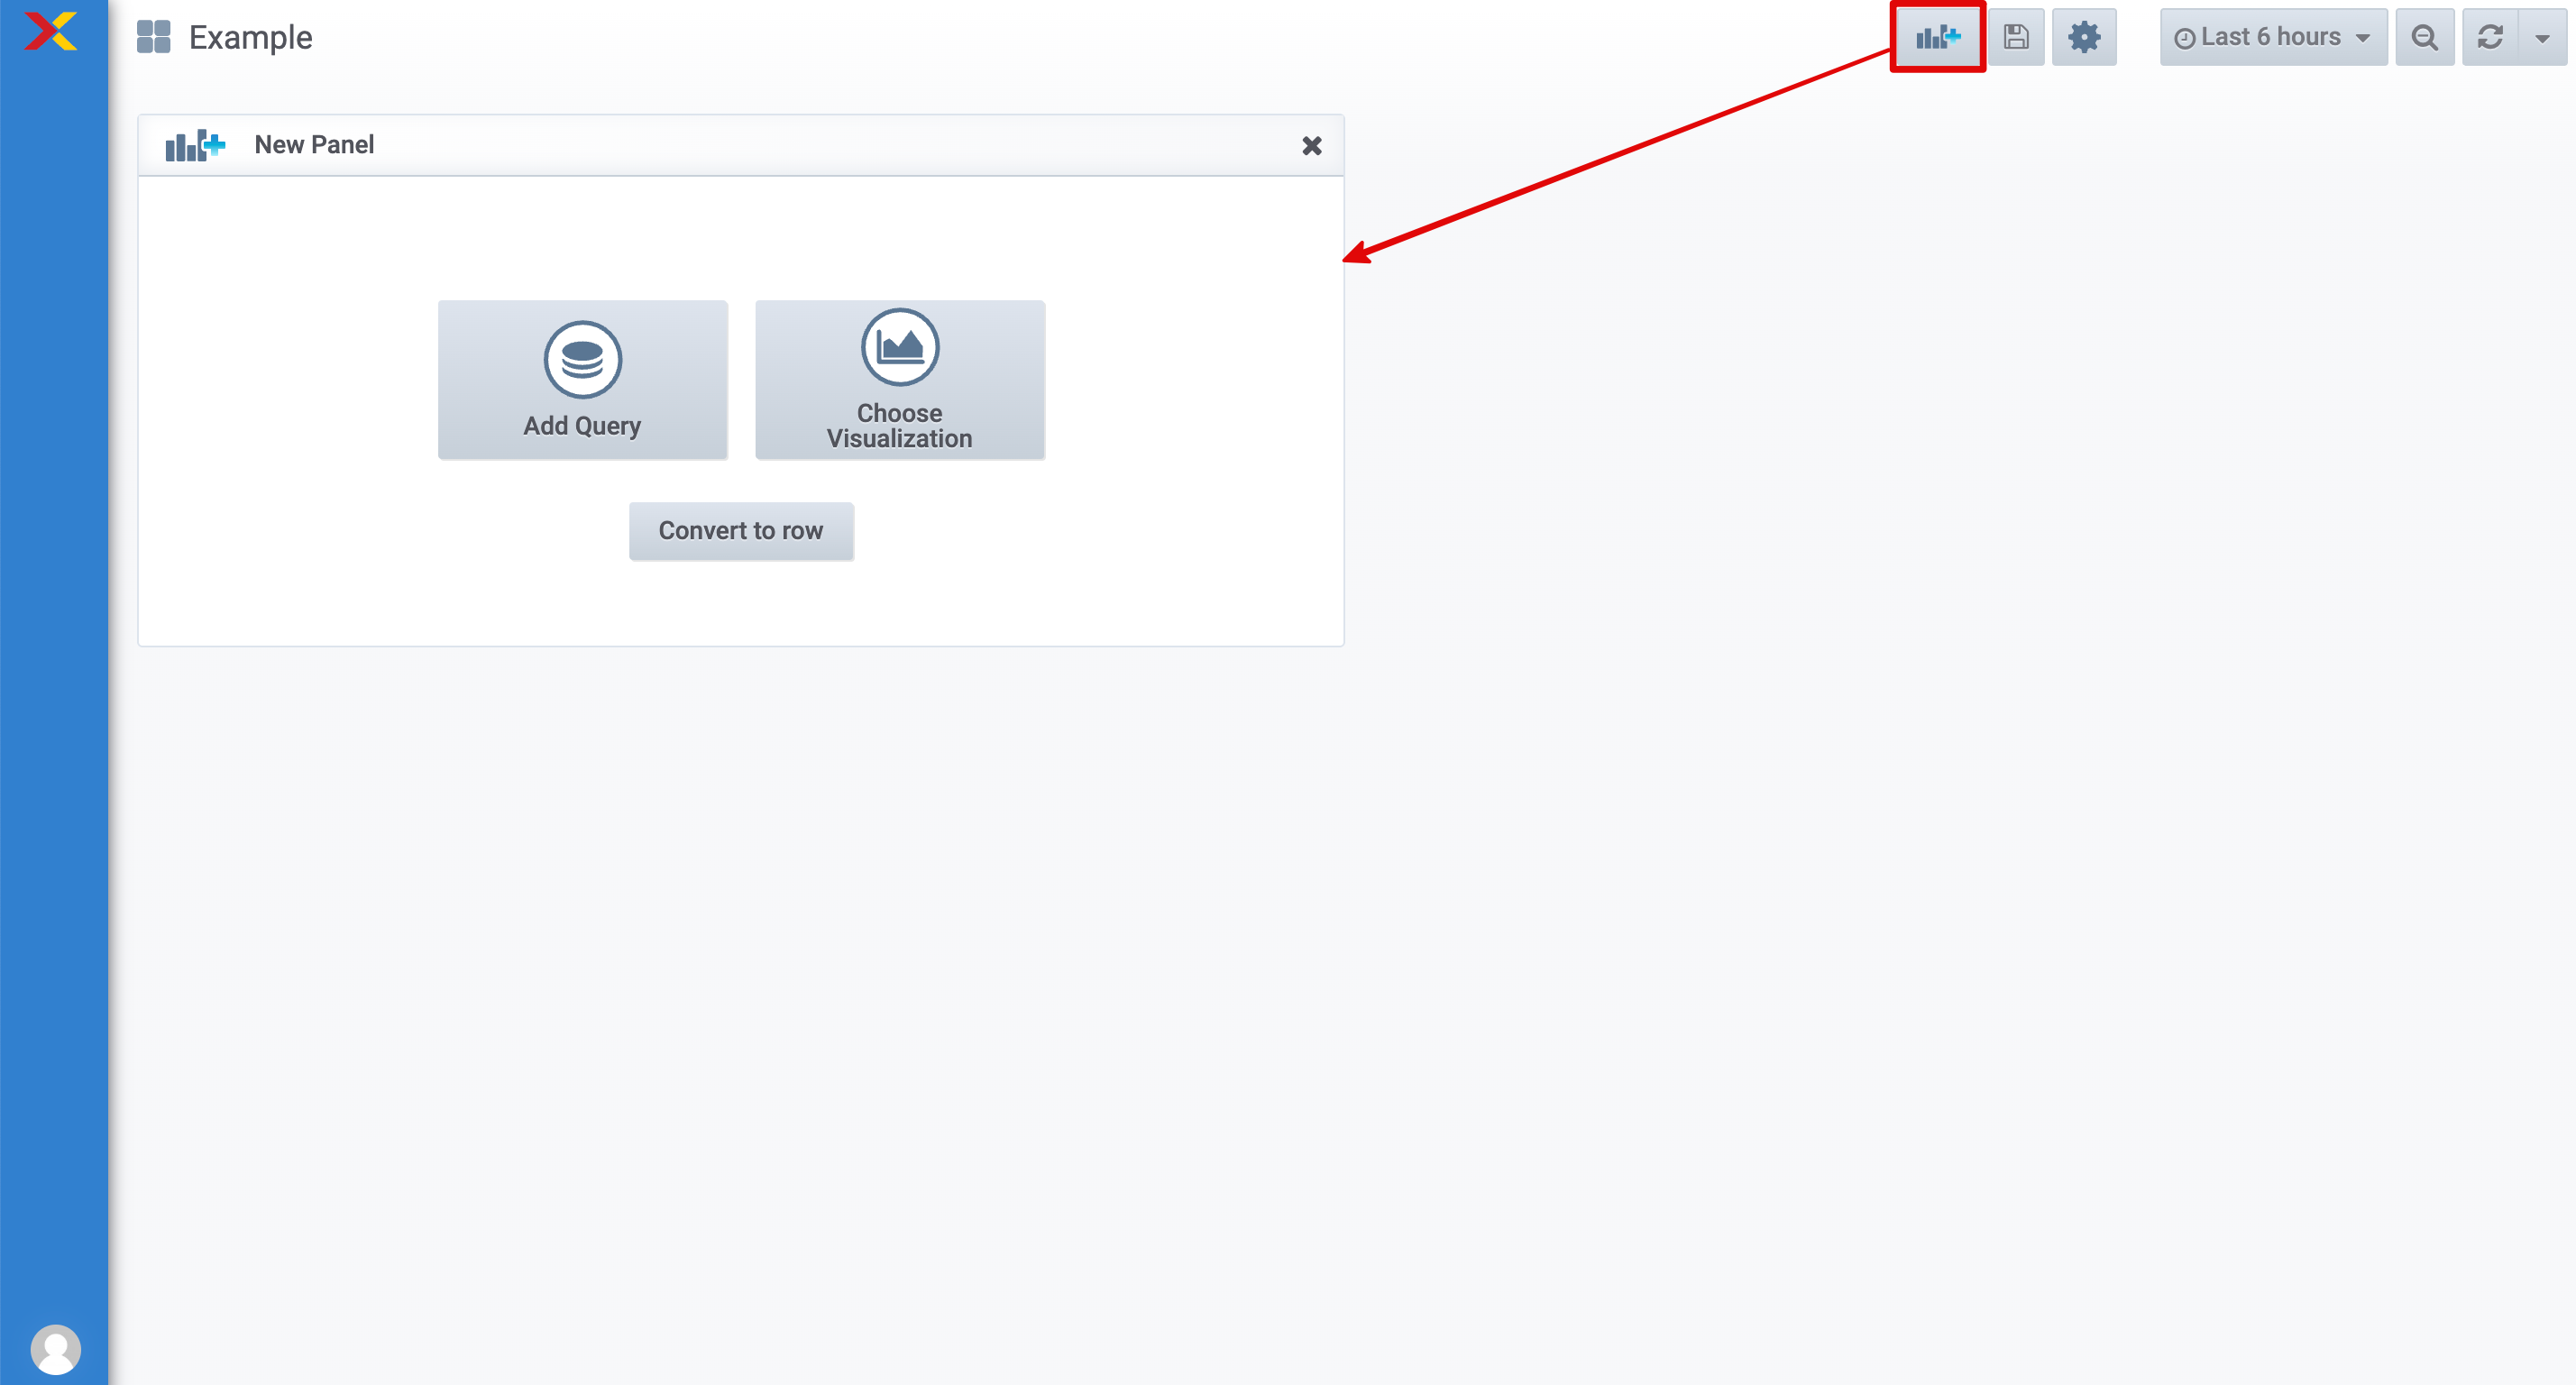
Then click on the "Add Query" button. The system will create a basic display box (Panel) in the form of a graph. The data that appears will be randomly assumed data (Random Walk). The first button in the upper right corner is "Save dashboard". Click to save when changing settings.
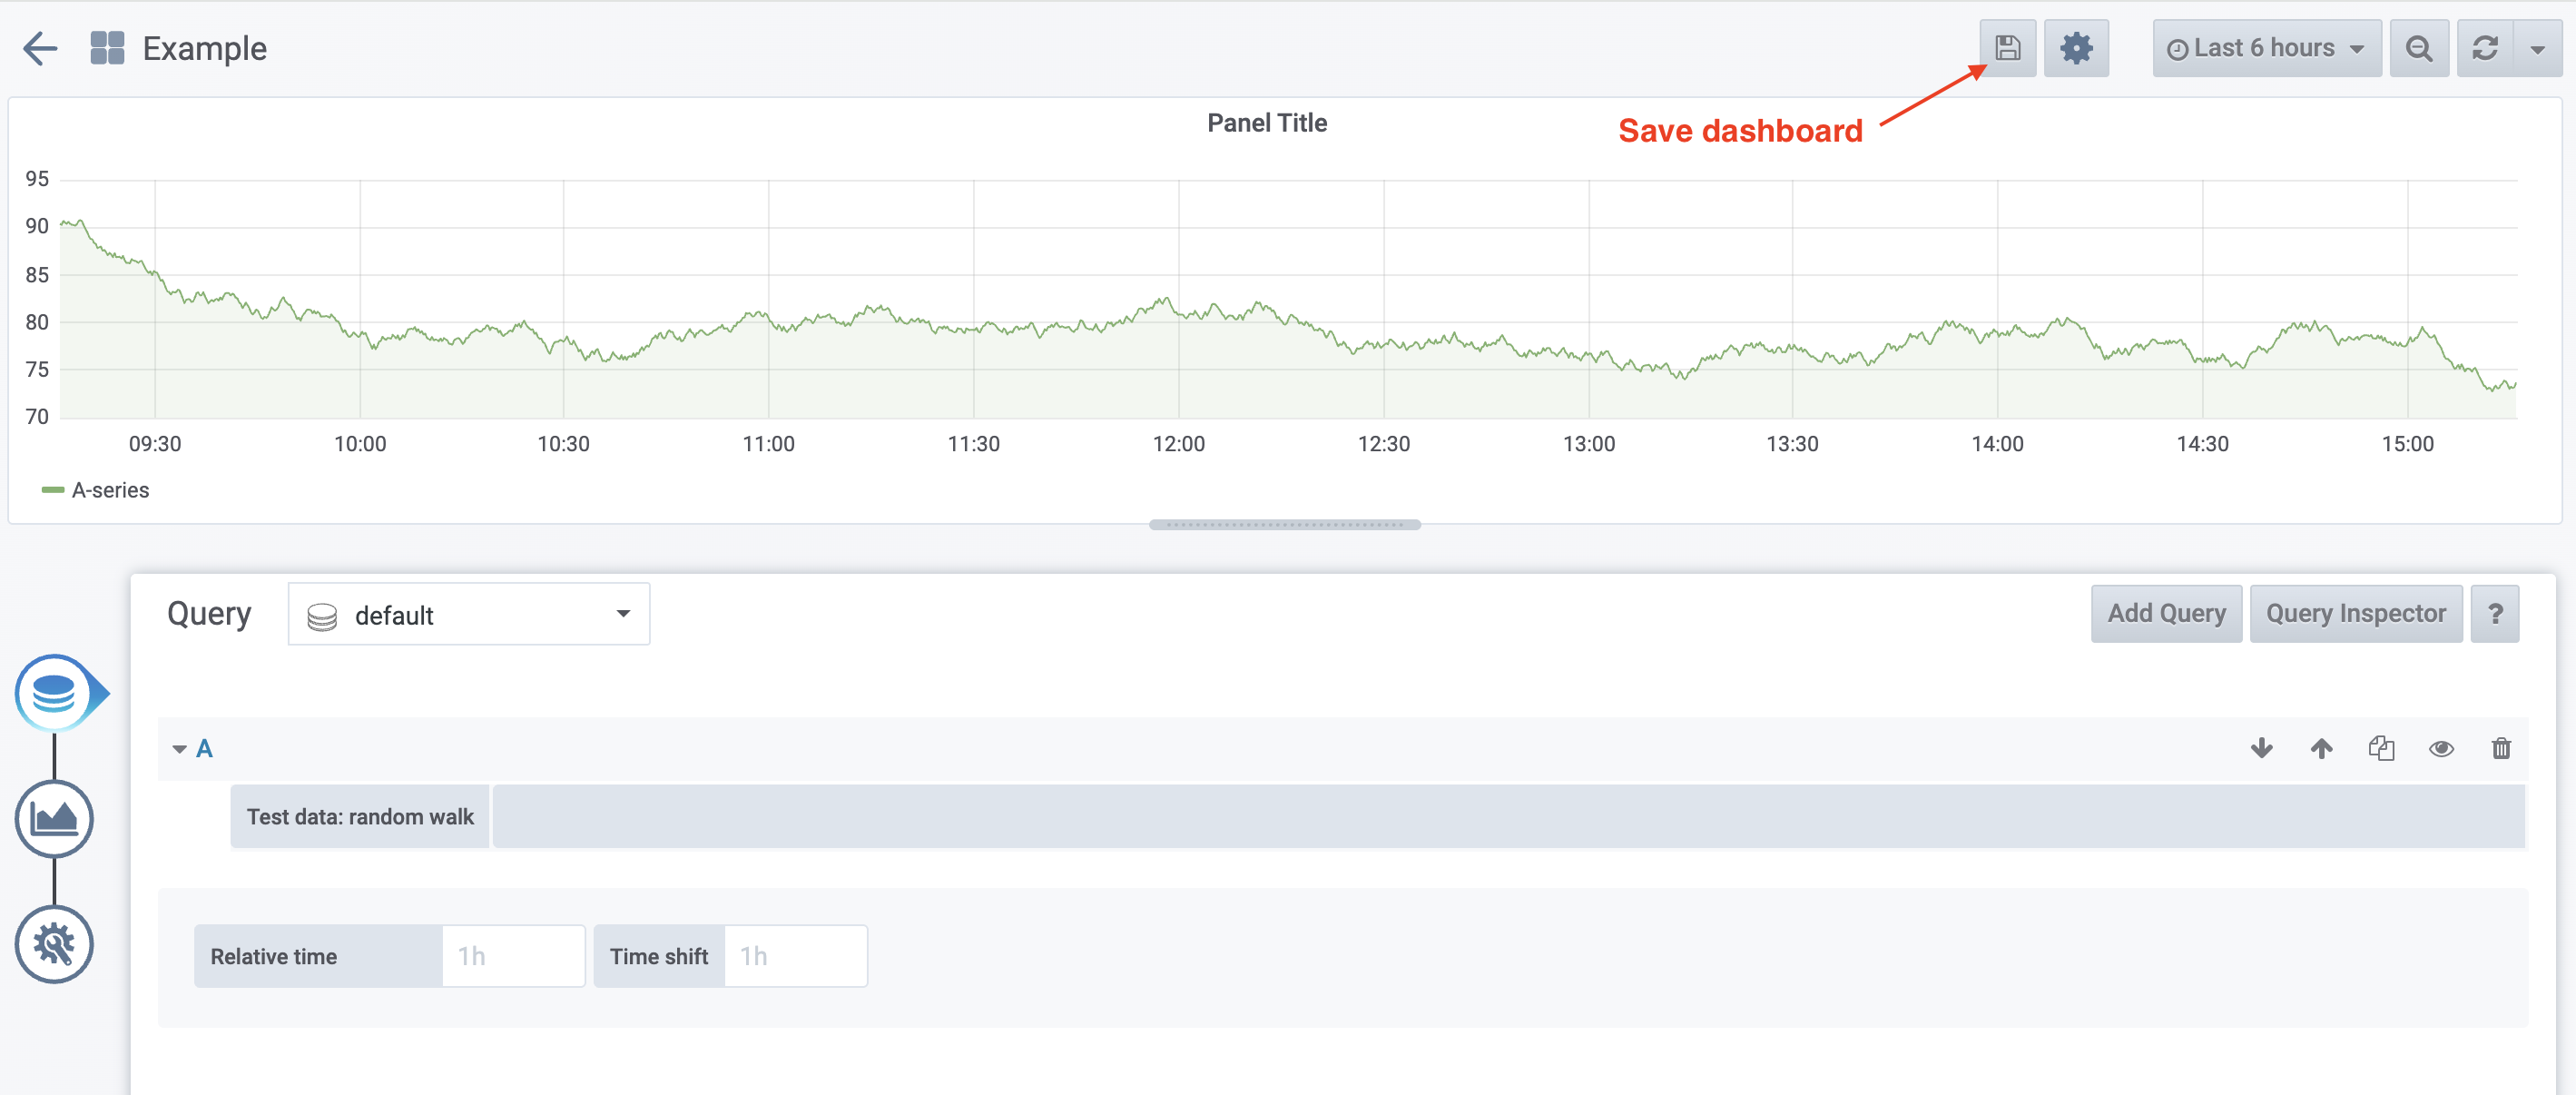
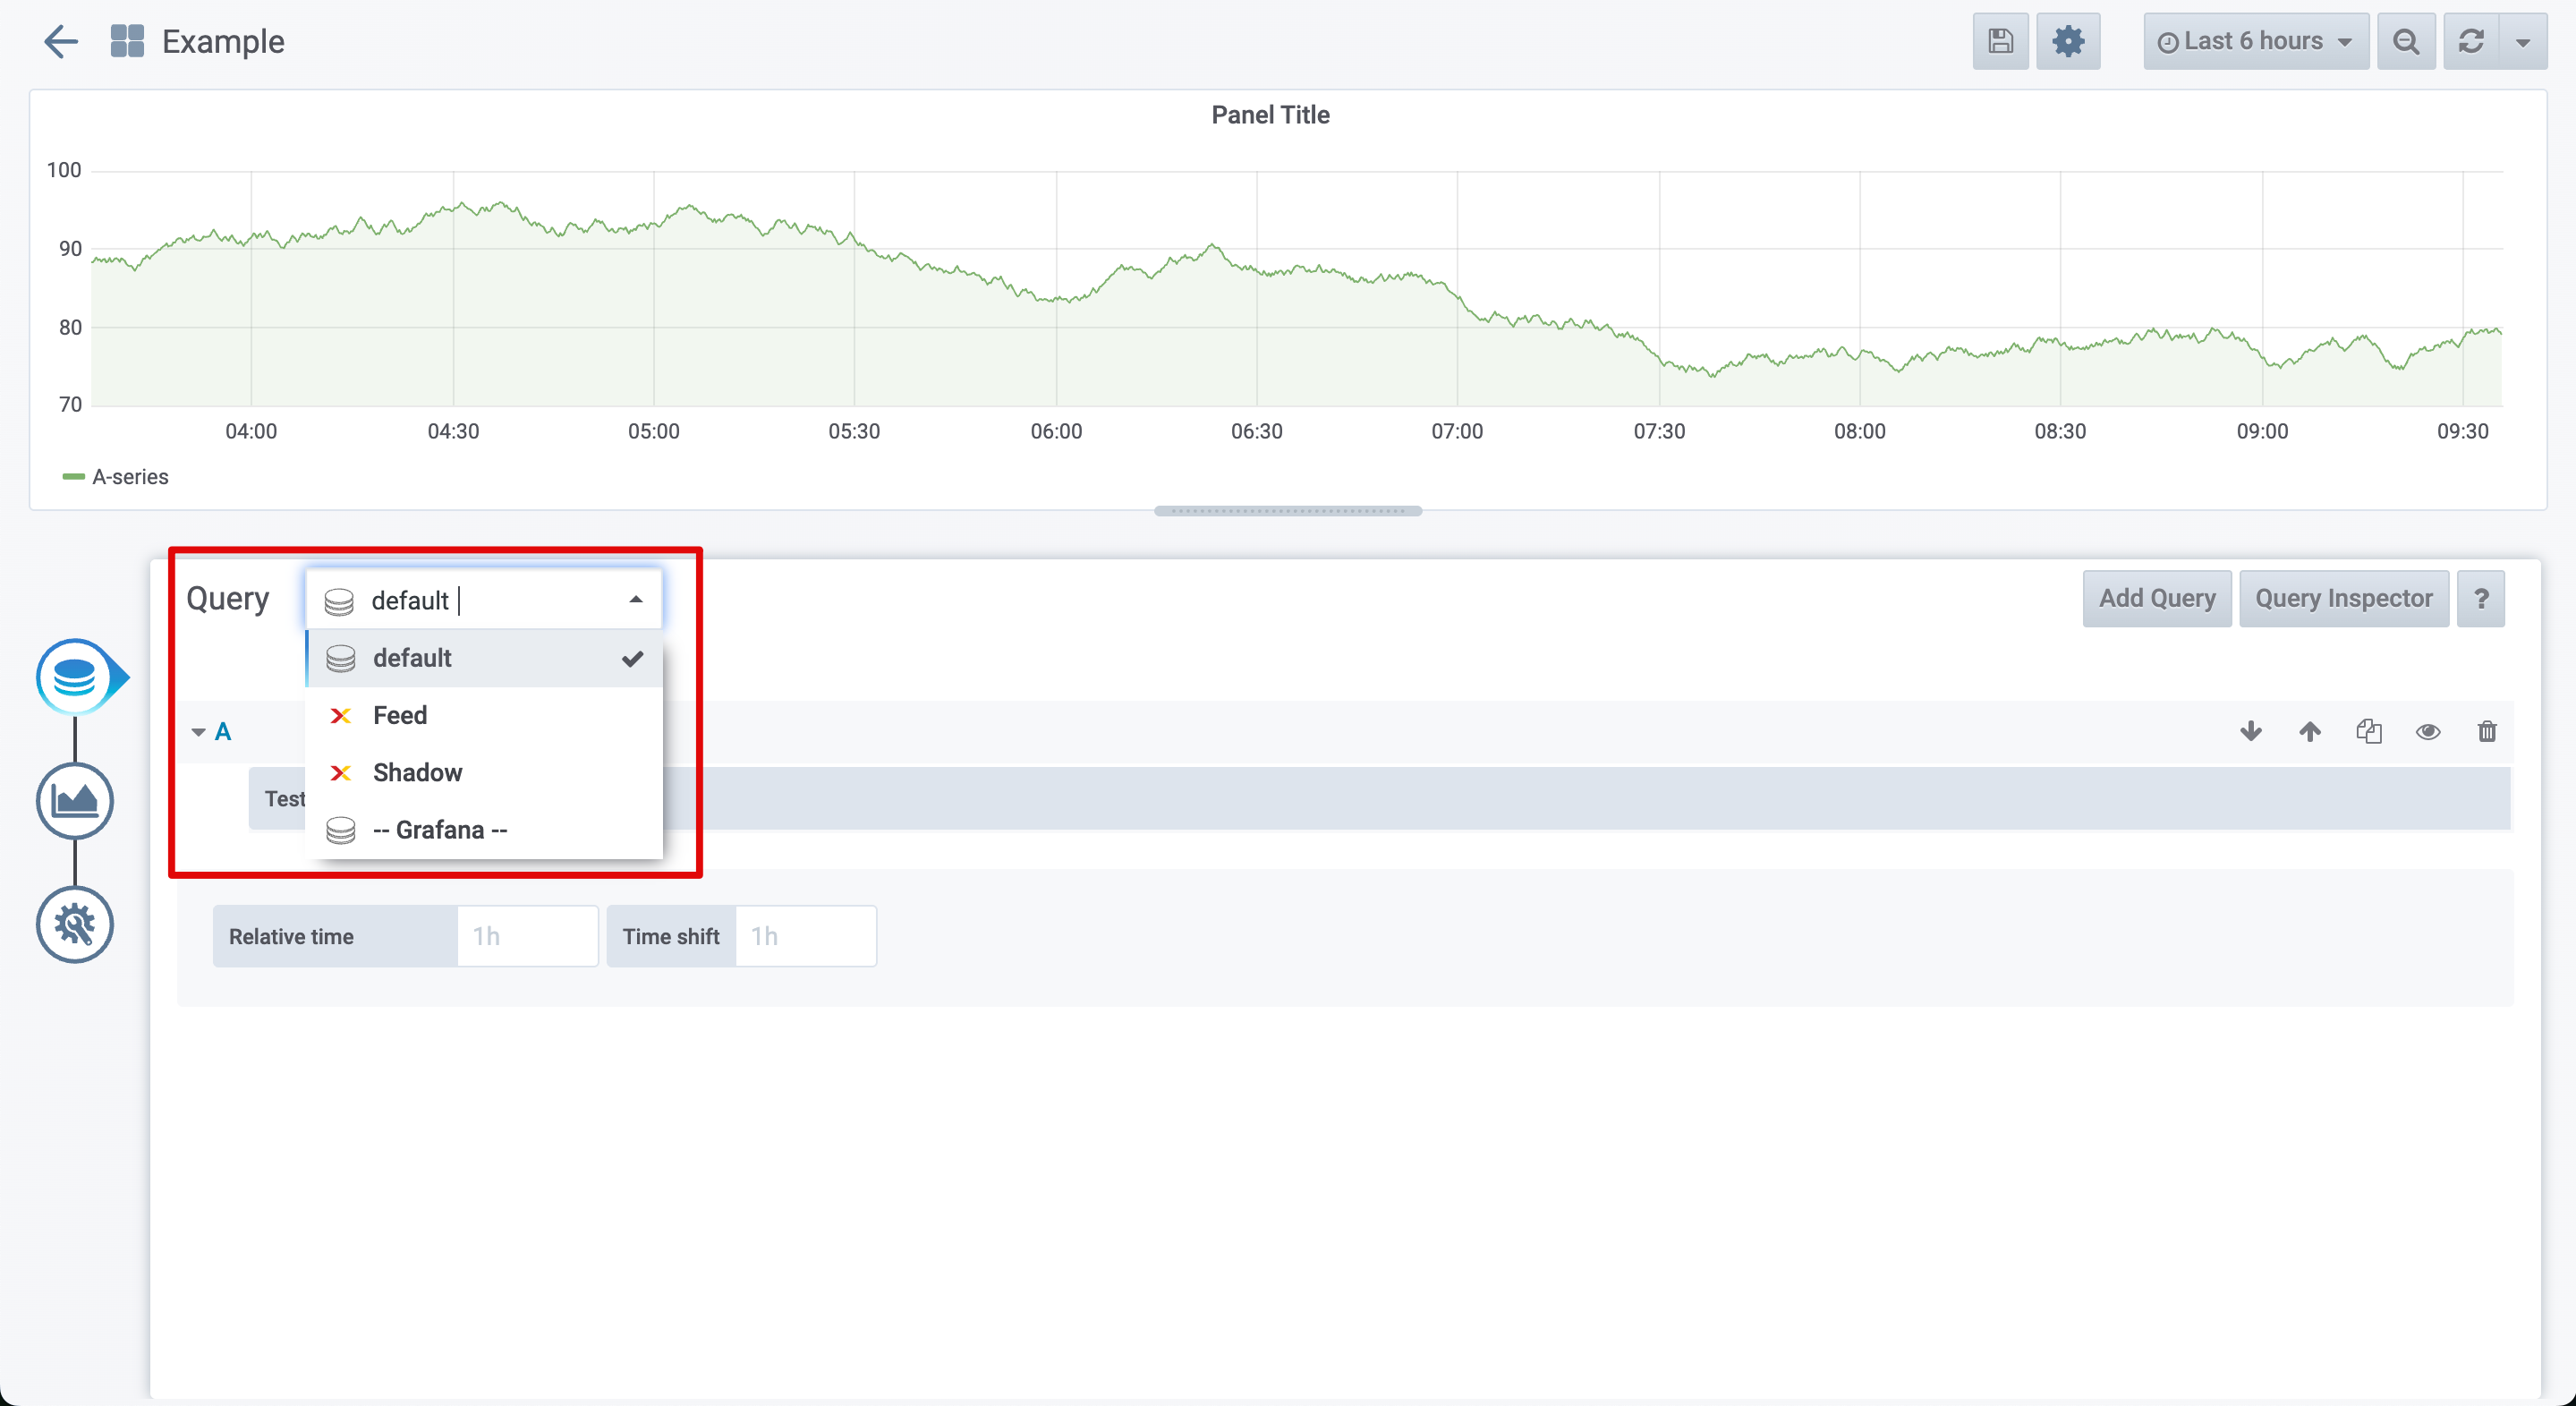
Setting up the command to retrieve data in the metric depends on the type of data source that the user selects. For NEXIIOT, 2 types of data sources that retrieve data from the Platform have been installed: Shadow and Feed. To select a data source, edit the "Query" drop-down as shown in the figure.
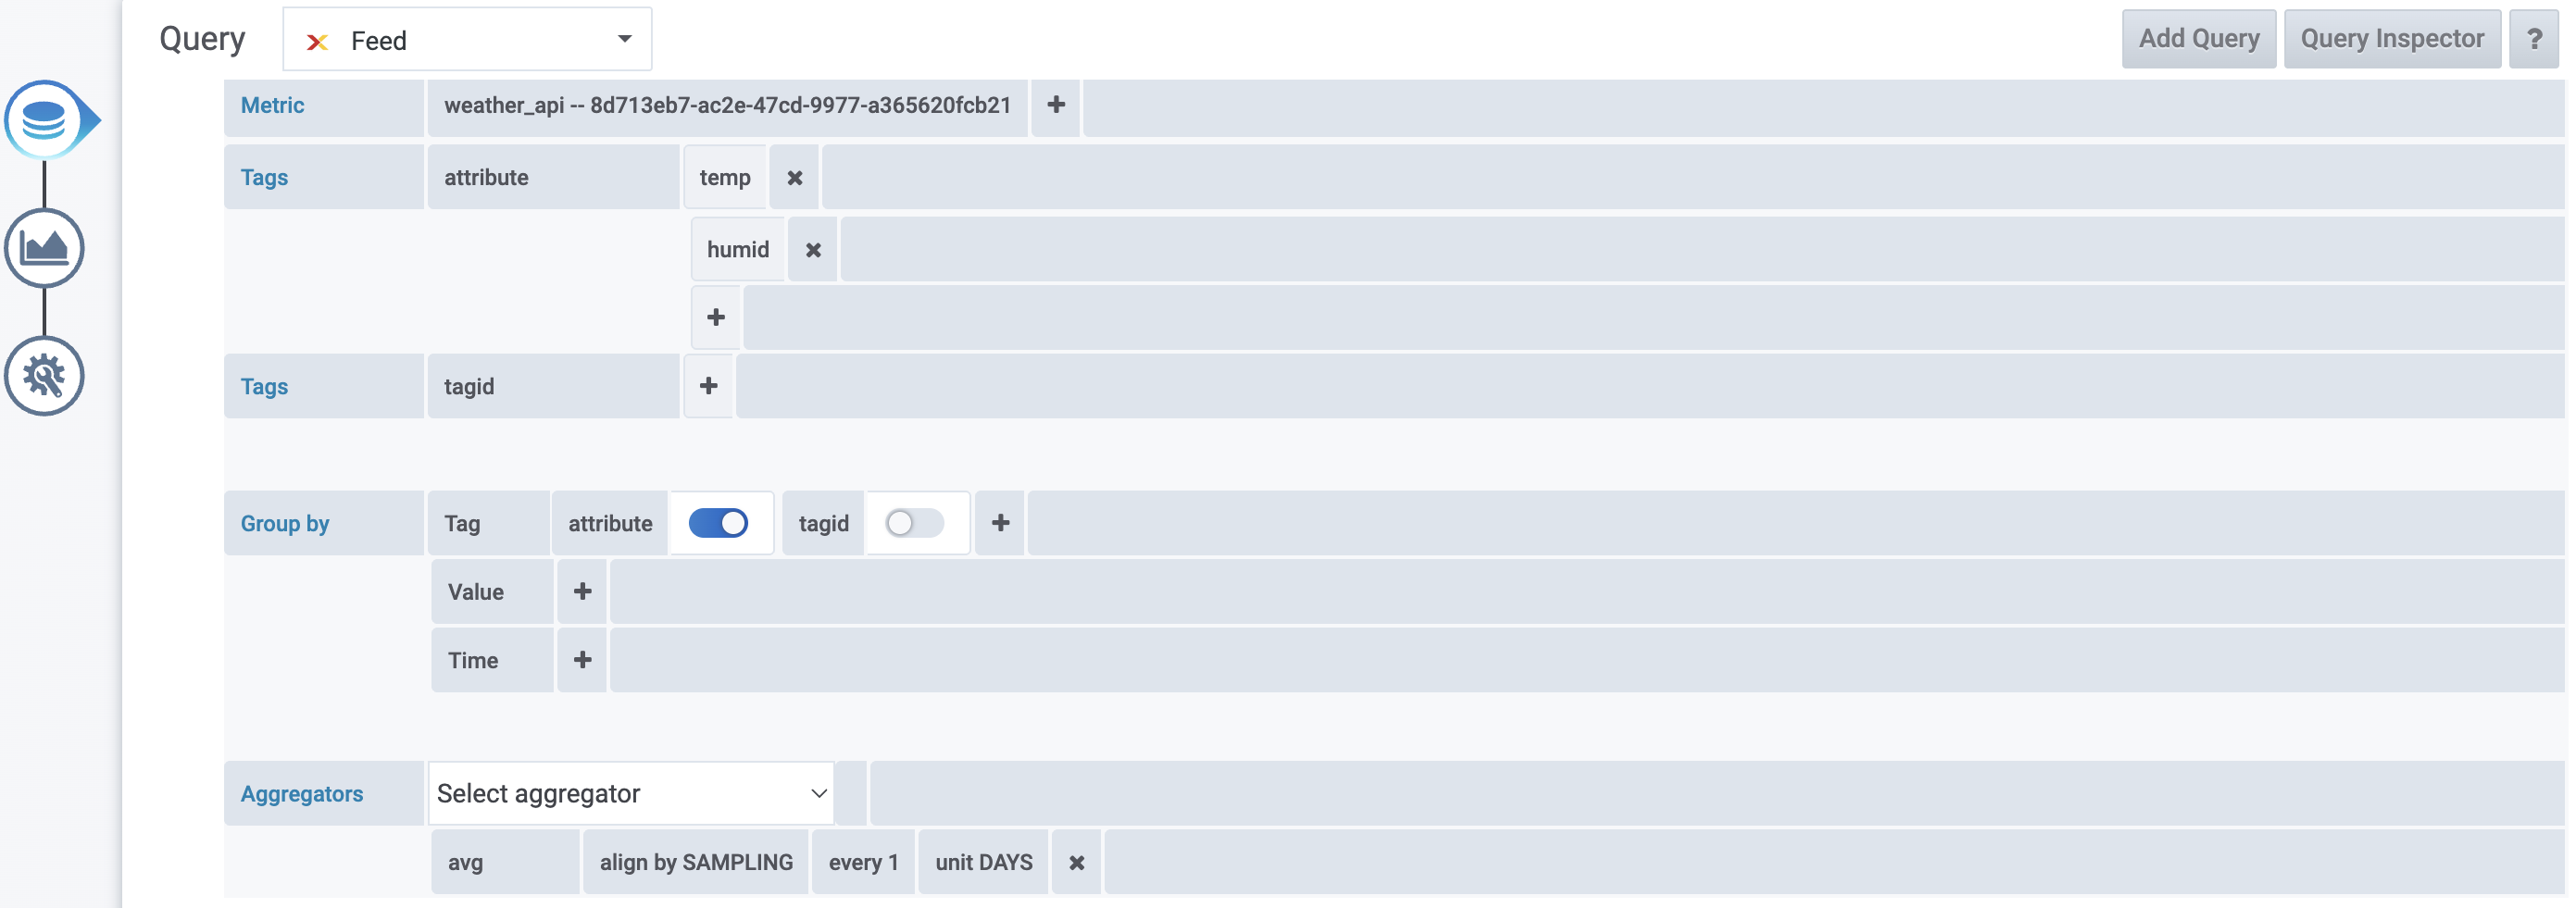
Datesource : Feed
Feed is a data storage in Timeseries Database. The data comes from Datatag which is set to store the data history of the data field from Shadow. The setup is done by following these steps.
Click the "Query" drop-down and select the item as "Feed".
On the "Metric" tab, click the "select metric" drop-down to change it to the name of the device (Client ID) for which you want to display data.
The "Tags" tab that appears after selecting a device shows information about the Datatag entries created under that device (Client ID). There are two tabs displayed. The top tab (attribute) shows the name (or Attr if specified) of the Datatag, and the bottom tab shows the Datatag ID. This setting is used when you want to display information on only some Datatags (the default is to display all). Click on the "+" sign and the system will display a list of Datatags for you to select and display.
The "Group by" tab groups the data points in the query by Tag, Time range, Data point value, or by Data bucket. In NEXIIOT Platform, Tags are used to group data (separated by Datatag).
The "Aggregators" tab is used to group data values in each time period in case of high-resolution values (data storage) into a single value. It is used when the device sends data values frequently, resulting in too many data points. The system will change the data values in each time period into the calculated values, such as avg, last, or max.
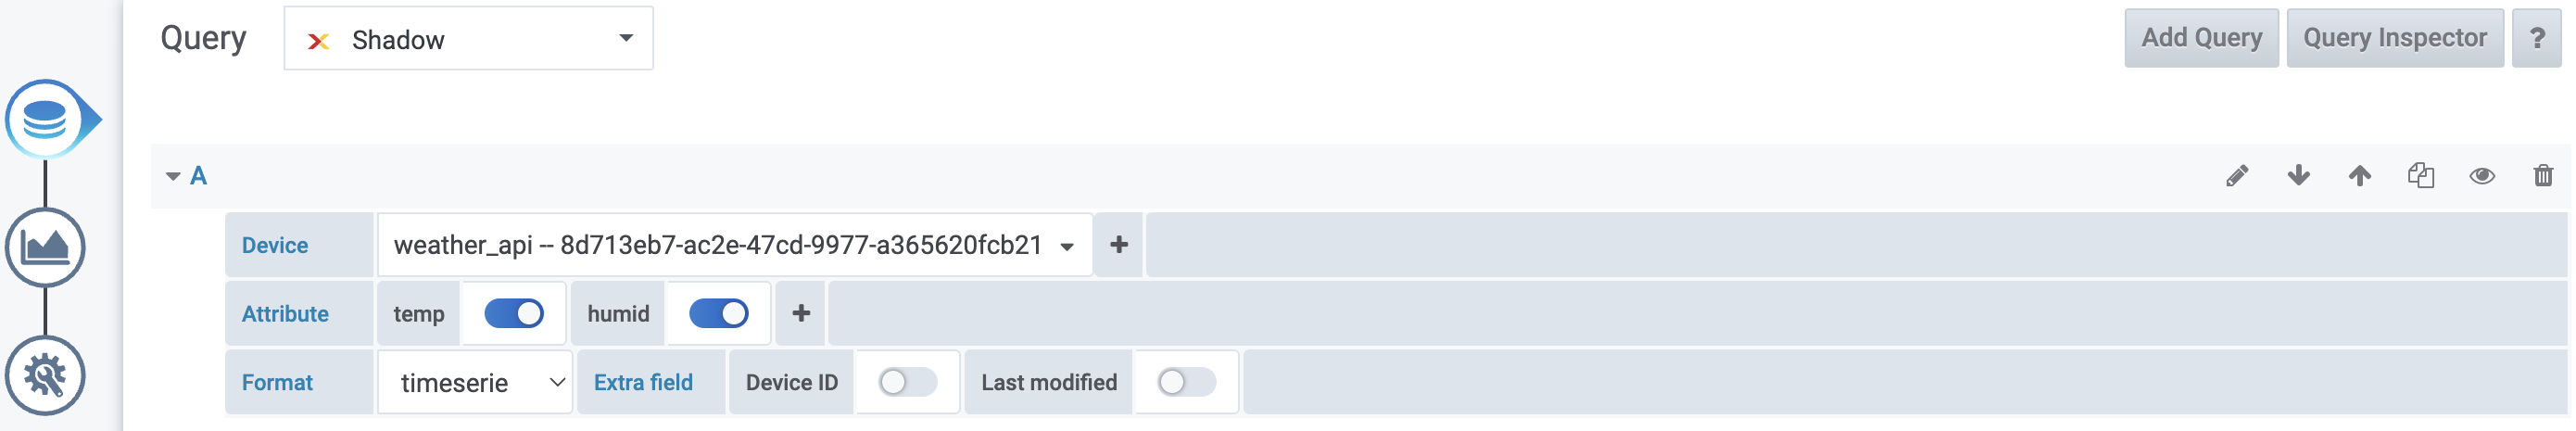
Datesource : Shadow
Shadow will only collect the most recently updated values. It is suitable for Realtime Monitoring. The settings are as follows.
Click the "Query" drop-down and select the "Shadow" item.
On the "Device" tab, click the "select metric" drop-down to change it to the name of the device (Client ID) to be displayed.
On the "Attribute" tab, click the "+" button to select the fields in the Shadow that you want to display.
Visualization Type
Different types of data may require different display methods to suit the data. Some data may require graphs to display historical data to see trends and trends, while some types require only the most recent data values to be displayed. To select the display format, click the "Visualization" symbol button on the left to enter the display format editing page as shown in the following figure.
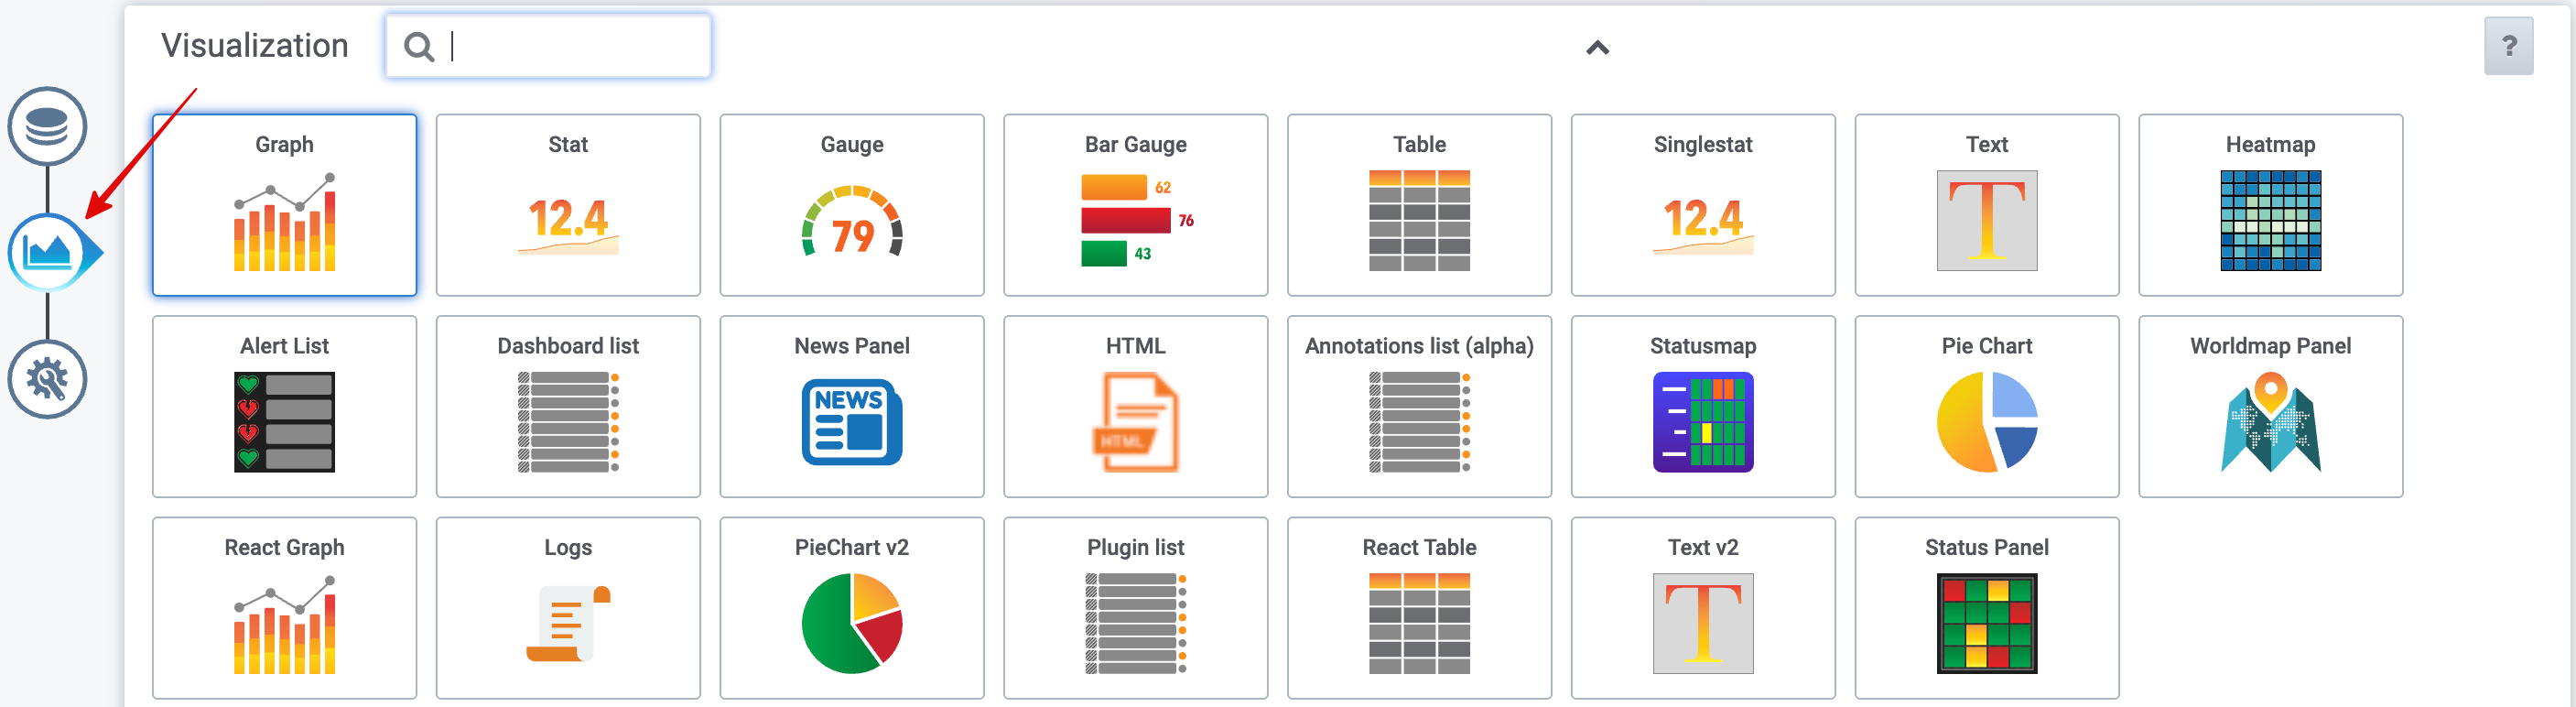
The image above shows the types of data display formats that can be selected. Here, we will explain some of the formats as follows:
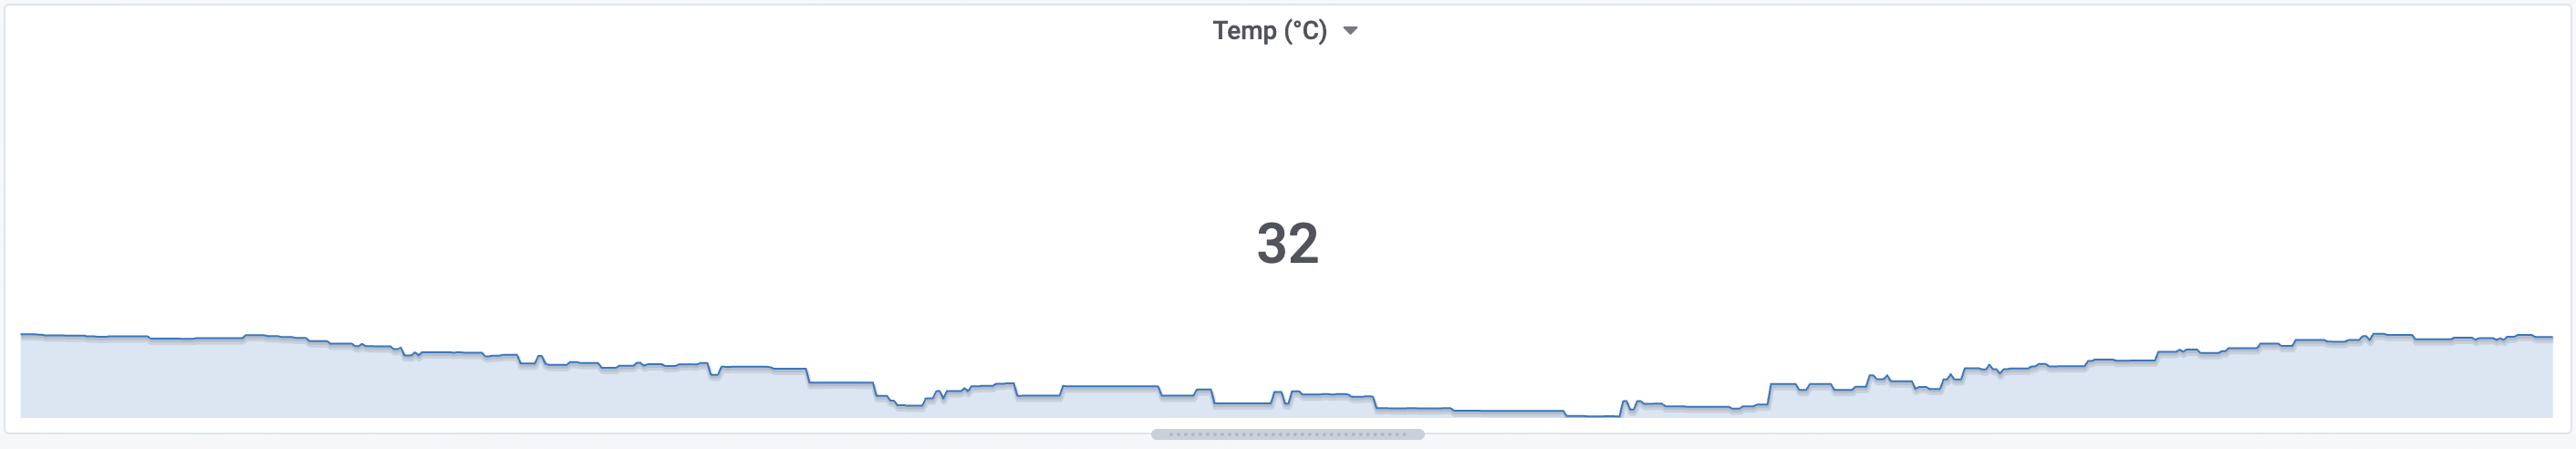
Graph is a basic display box of Grafana that has many tools to use. It is suitable for displaying data stored as a Feed (Platform Datasource) because it can display the numerical data values of the device in the past. However, it is not suitable for displaying Shadow because it will display only one point of incoming data, which is the latest data value or current data of the device only.
Singlestat is a summary of the display of device data using statistical methods, such as the maximum value, minimum value, or the sum of the data values in a period of time, to reduce it to only one value. It can also convert the obtained statistical data into text that indicates the characteristics of the obtained data results and can display graphs or images that make it easier to understand the characteristics of the data. This type of data display can be used with both Feed to display statistical values calculated from the device data values and Shadow to display the latest data values of the device.
Gauge is a single value numeric display. It is suitable for displaying data stored in Shadow (Platform datasource). It is a gauge that changes data values.
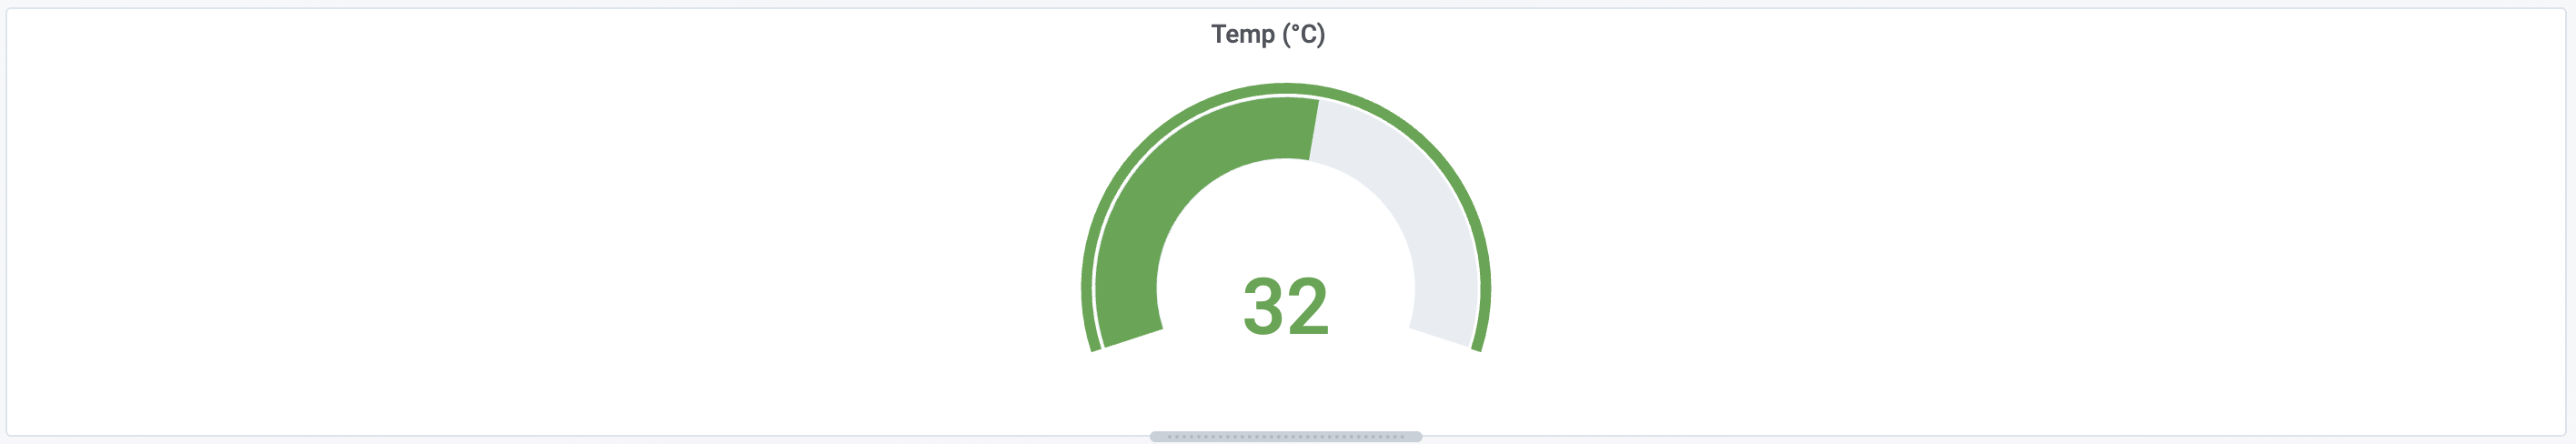
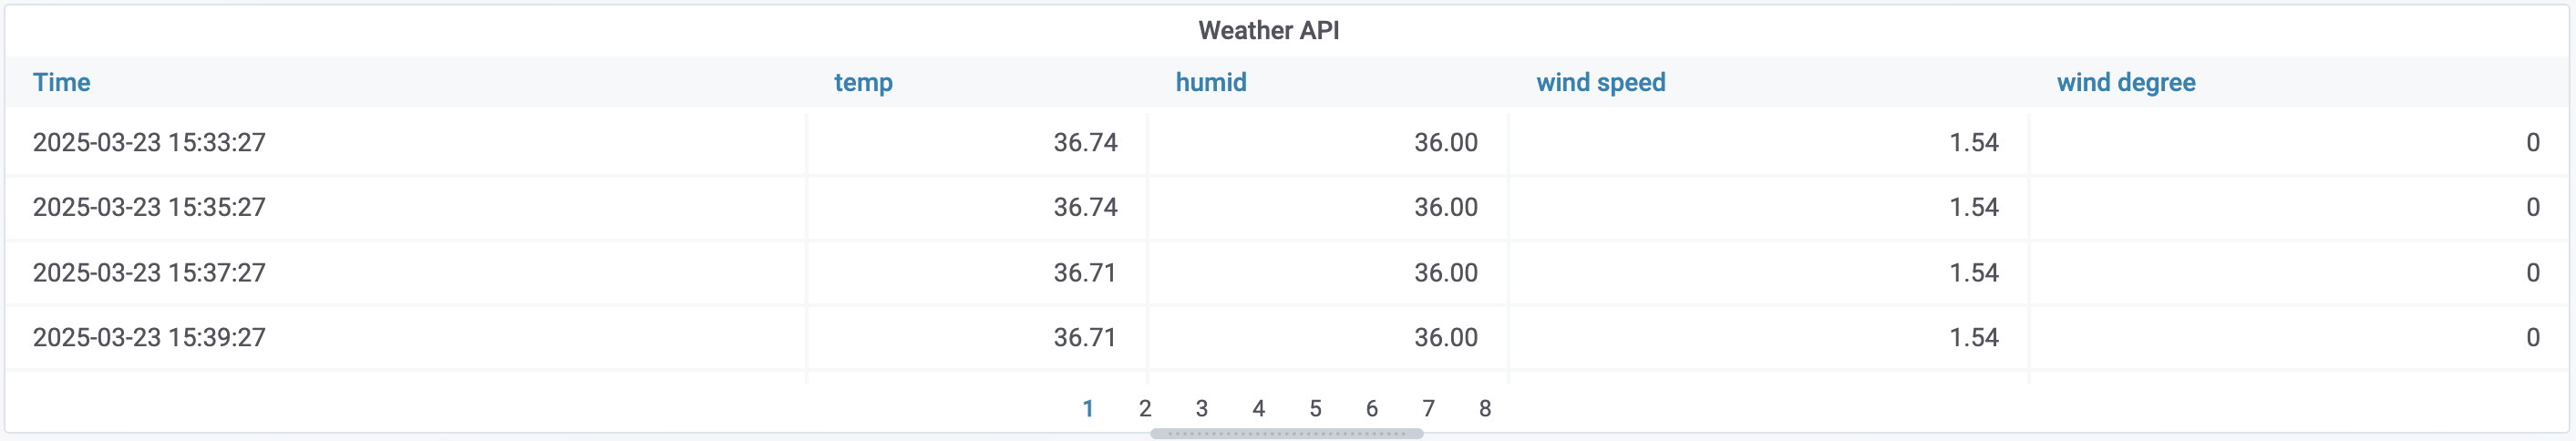
Table is a tabular data display. It can display both Feed and Shadow data, and supports non-numeric data.
General settings
Used for setting other settings of the Panel covering the Visualization, including setting additional details of each Visualization that is selected for use, which will be different in each Visualization. It focuses on adjusting for beauty and orderliness of data display. Click the "General" symbol button on the left to enter the data setting page as shown in the following figure.
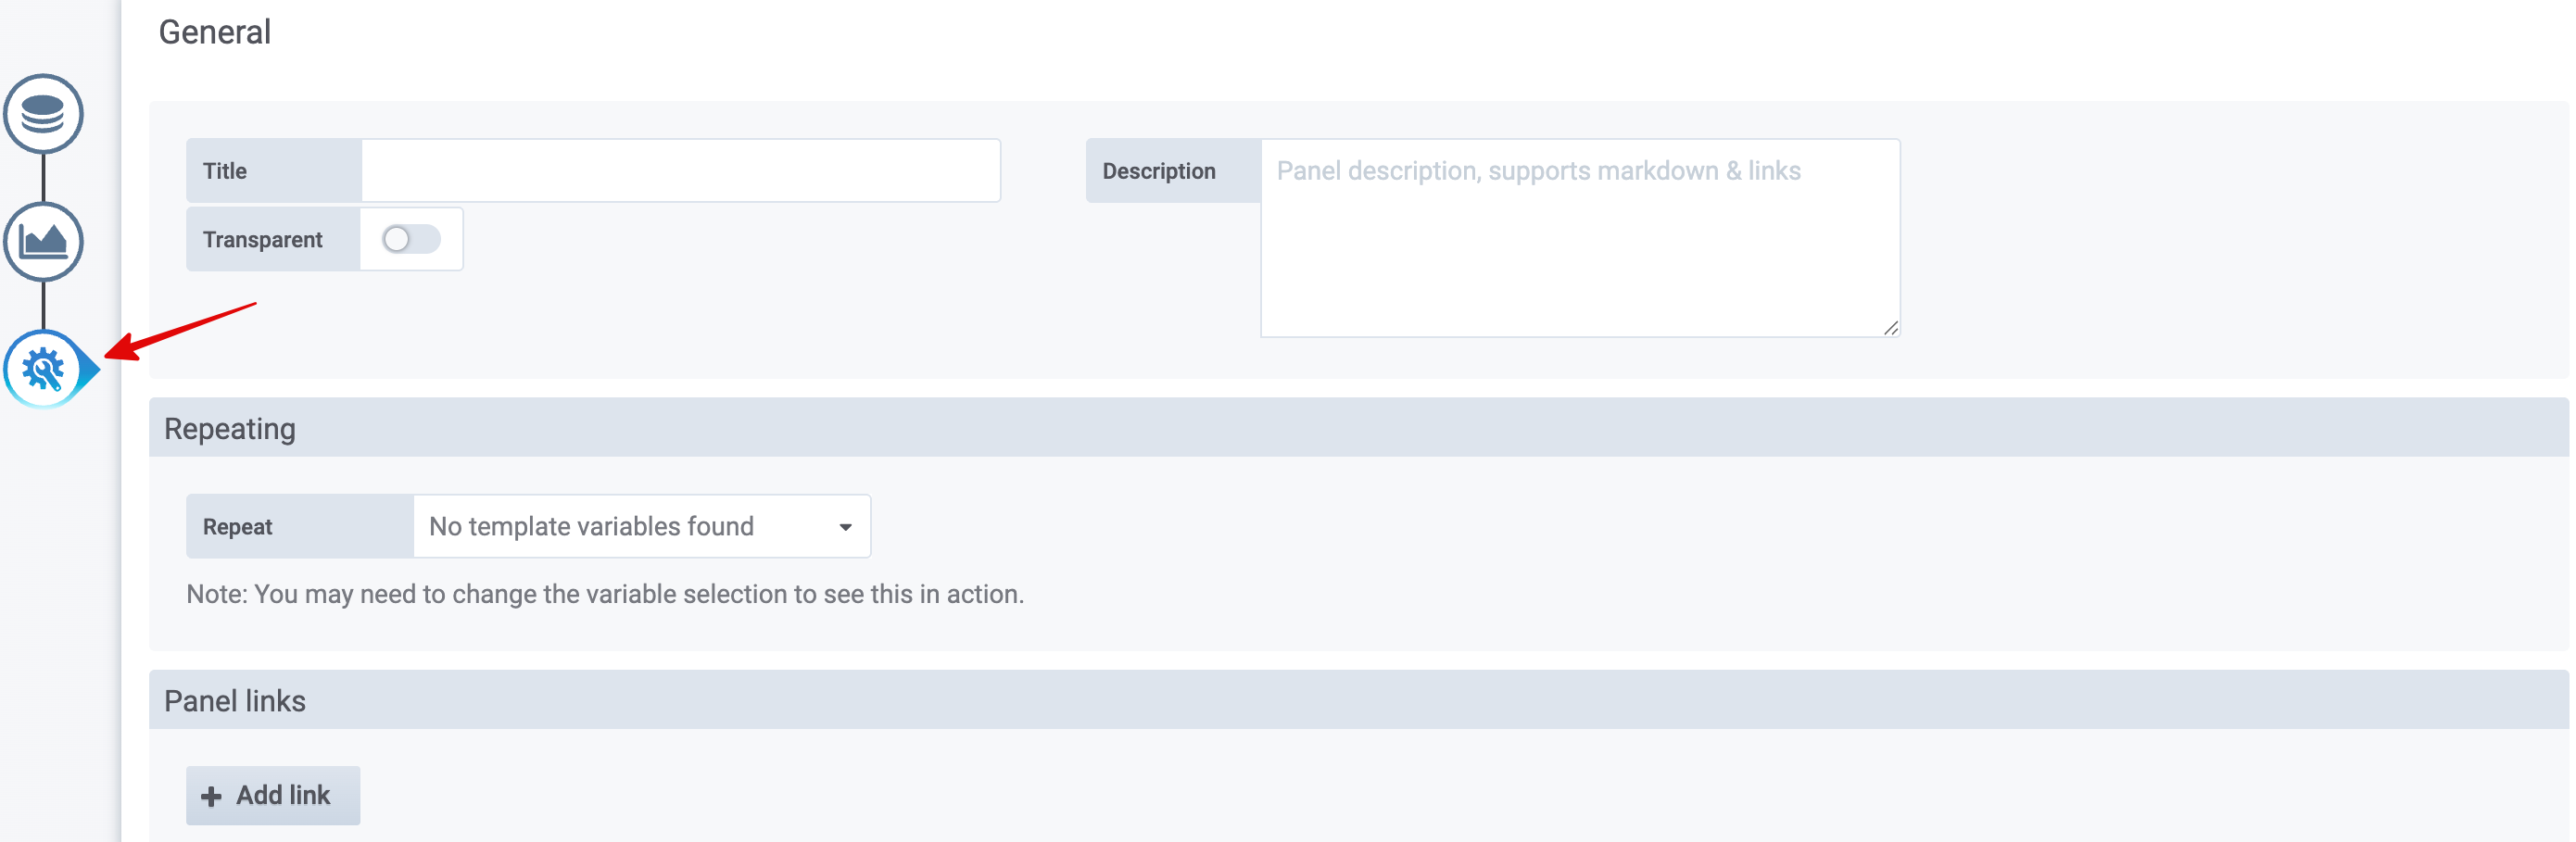
From the image above, the main settings of the Panel are as follows:
Title is the name of the Panel or display section.
Description is a description of the Panel or display section.
Transparent sets the transparency of the panel background or display area.
Panel links Links to other websites, if set, will appear as an arrow in the upper left corner of the panel or display area, allowing you to click on links to those websites.
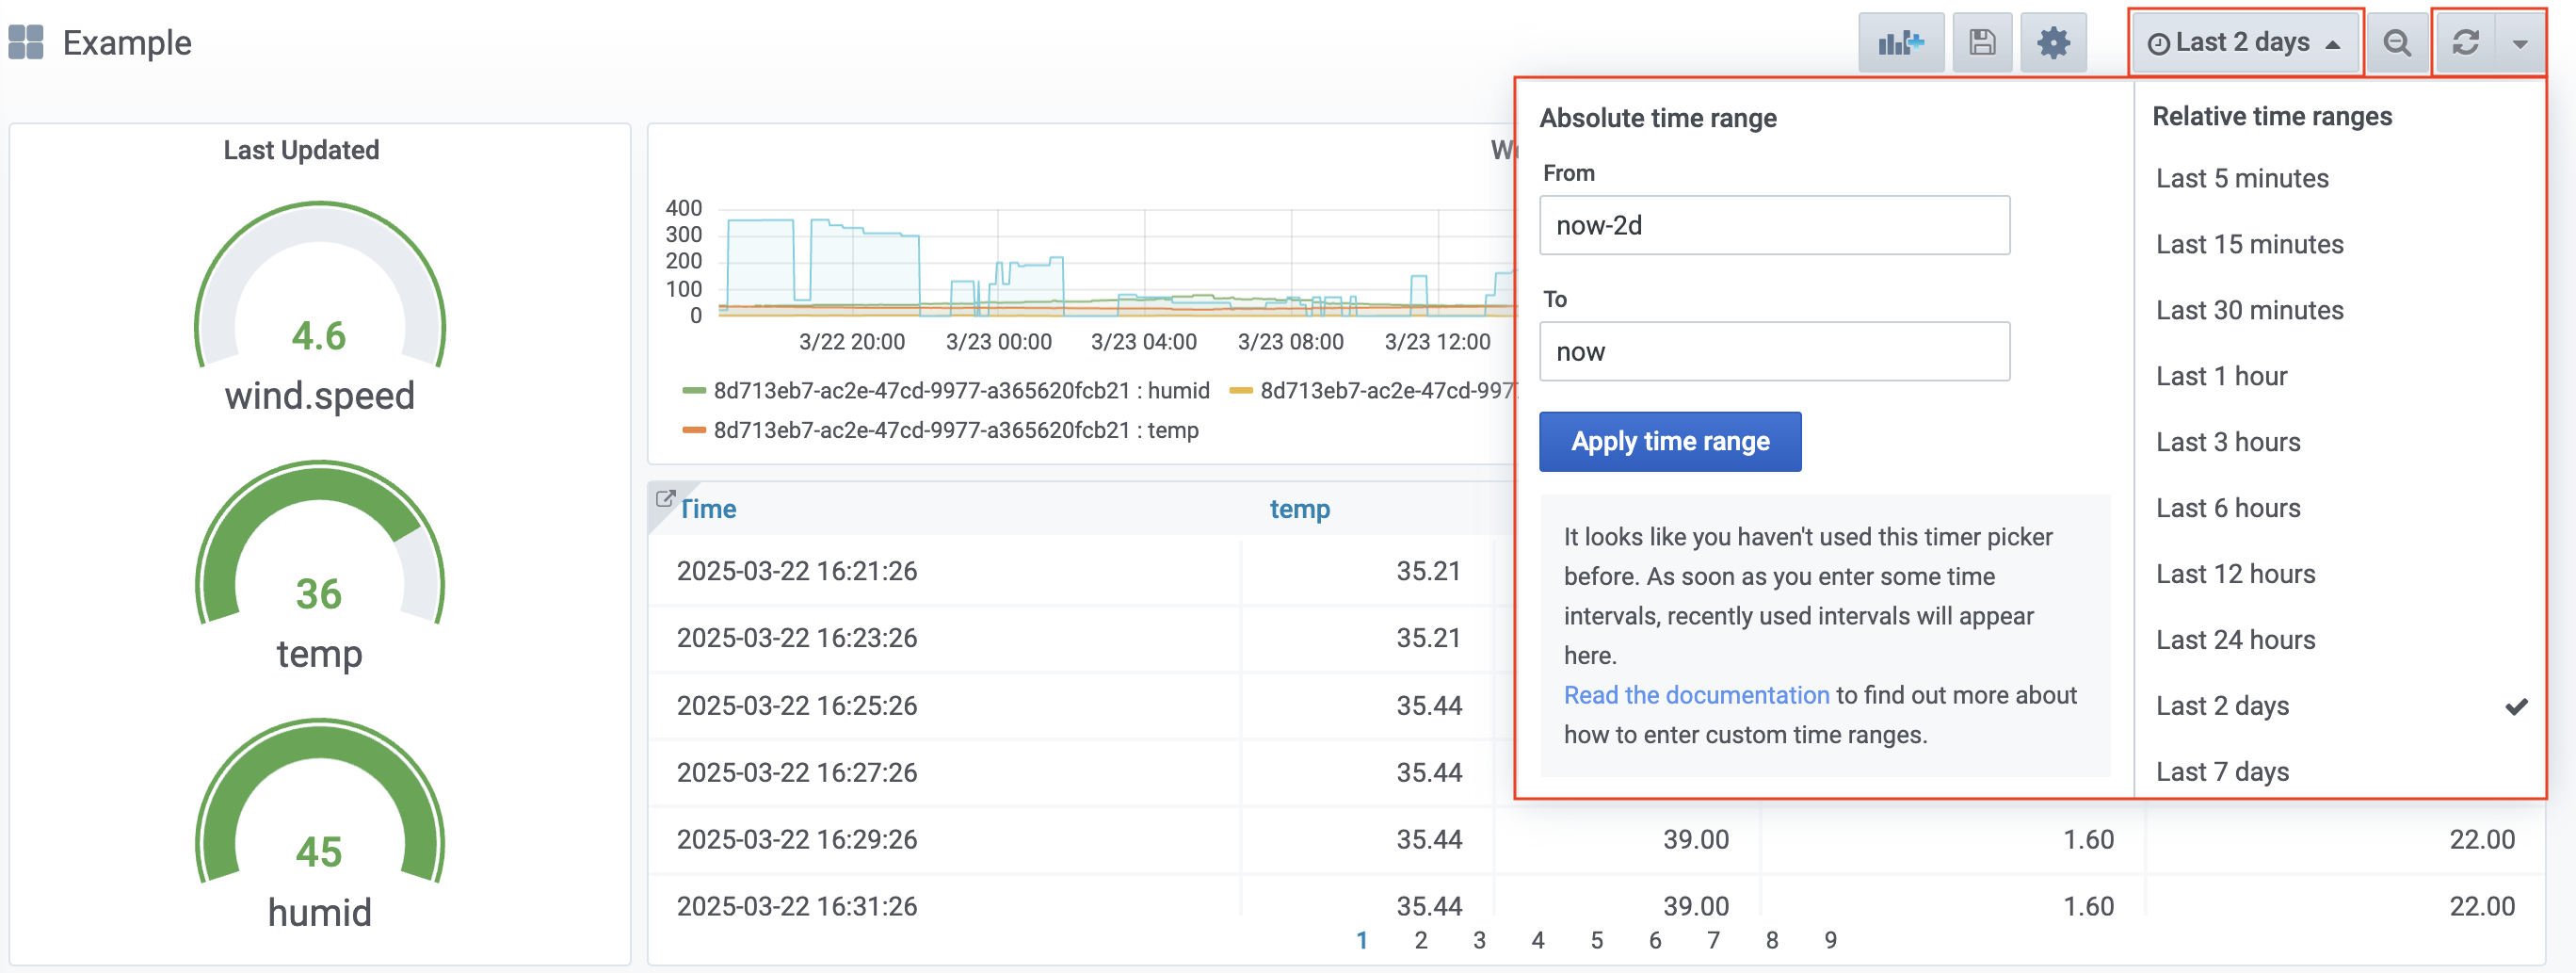
In addition to the settings mentioned above, there is also a section for selecting the time range and the refresh interval to obtain the data that you want to display. The settings are located in the upper right corner of the system, as shown in the following figure.